29
/
en
AIzaSyAYiBZKx7MnpbEhh9jyipgxe19OcubqV5w
April 1, 2024
167760
Kenya
KEN
true
2
1
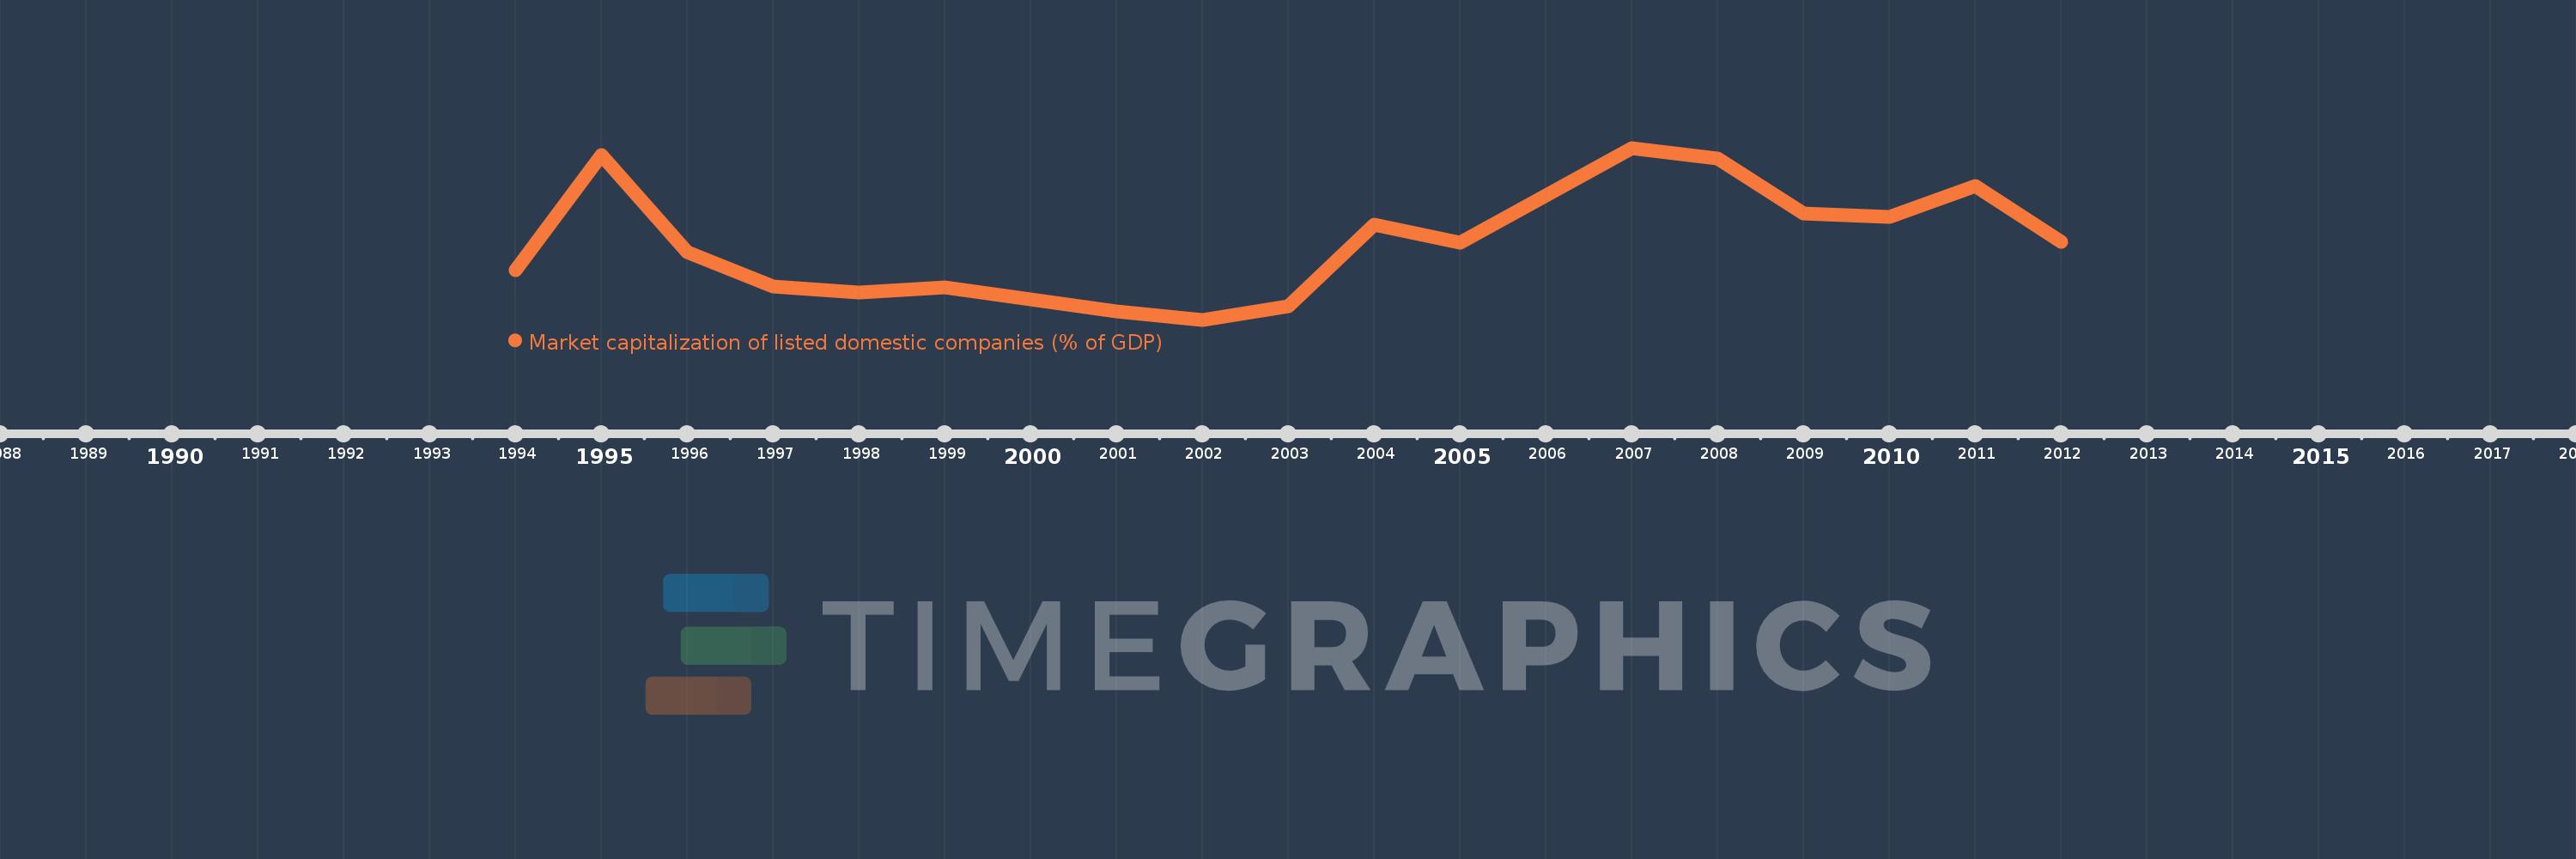
Market capitalization of listed domestic companies (% of GDP)
2012,2011,2010,2009,2008,2007,2006,2005,2004,2003,2002,2001,1999,1998,1997,1996,1995,1994
This statistics in other country:
Timeline:
This timeline shows a graph from 1994 to 2012 of Kenya. No data until 1993. Number of actual observations by date: 18.
Source name:
World Development Indicators
Source organization:
World Federation of Exchanges database.
Categories, topics:
Financial Sector
Last updated:
apr 23, 2017
Indicators value changes by year
Maximum:
44.057
jan 1, 2007
At the date of observation
Value
Absolute change
Change from previous value
jan 1, 1994
18.483
+18.483
0.0%
jan 1, 1995
42.622
+24.139
130.6%
jan 1, 1996
22.302
-20.32
-47.68%
jan 1, 1997
14.935
-7.367
-33.03%
jan 1, 1998
13.823
-1.112
-7.44%
jan 1, 1999
14.819
+0.996
7.2%
jan 1, 2001
9.881
-4.938
-33.32%
jan 1, 2002
8.049
-1.831
-18.53%
jan 1, 2003
10.886
+2.837
35.24%
jan 1, 2004
28.064
+17.178
157.79%
jan 1, 2005
24.175
-3.889
-13.86%
jan 1, 2006
34.07
+9.895
40.93%
jan 1, 2007
44.057
+9.987
29.31%
jan 1, 2008
41.756
-2.301
-5.22%
jan 1, 2009
30.238
-11.518
-27.58%
jan 1, 2010
29.623
-0.616
-2.04%
jan 1, 2011
36.152
+6.53
22.04%
jan 1, 2012
24.319
-11.834
-32.73%
Ranking of countries by current statistics by years


Comments: