29
/
en
AIzaSyAYiBZKx7MnpbEhh9jyipgxe19OcubqV5w
April 1, 2024
166418
Kazakhstan
KAZ
true
2
1
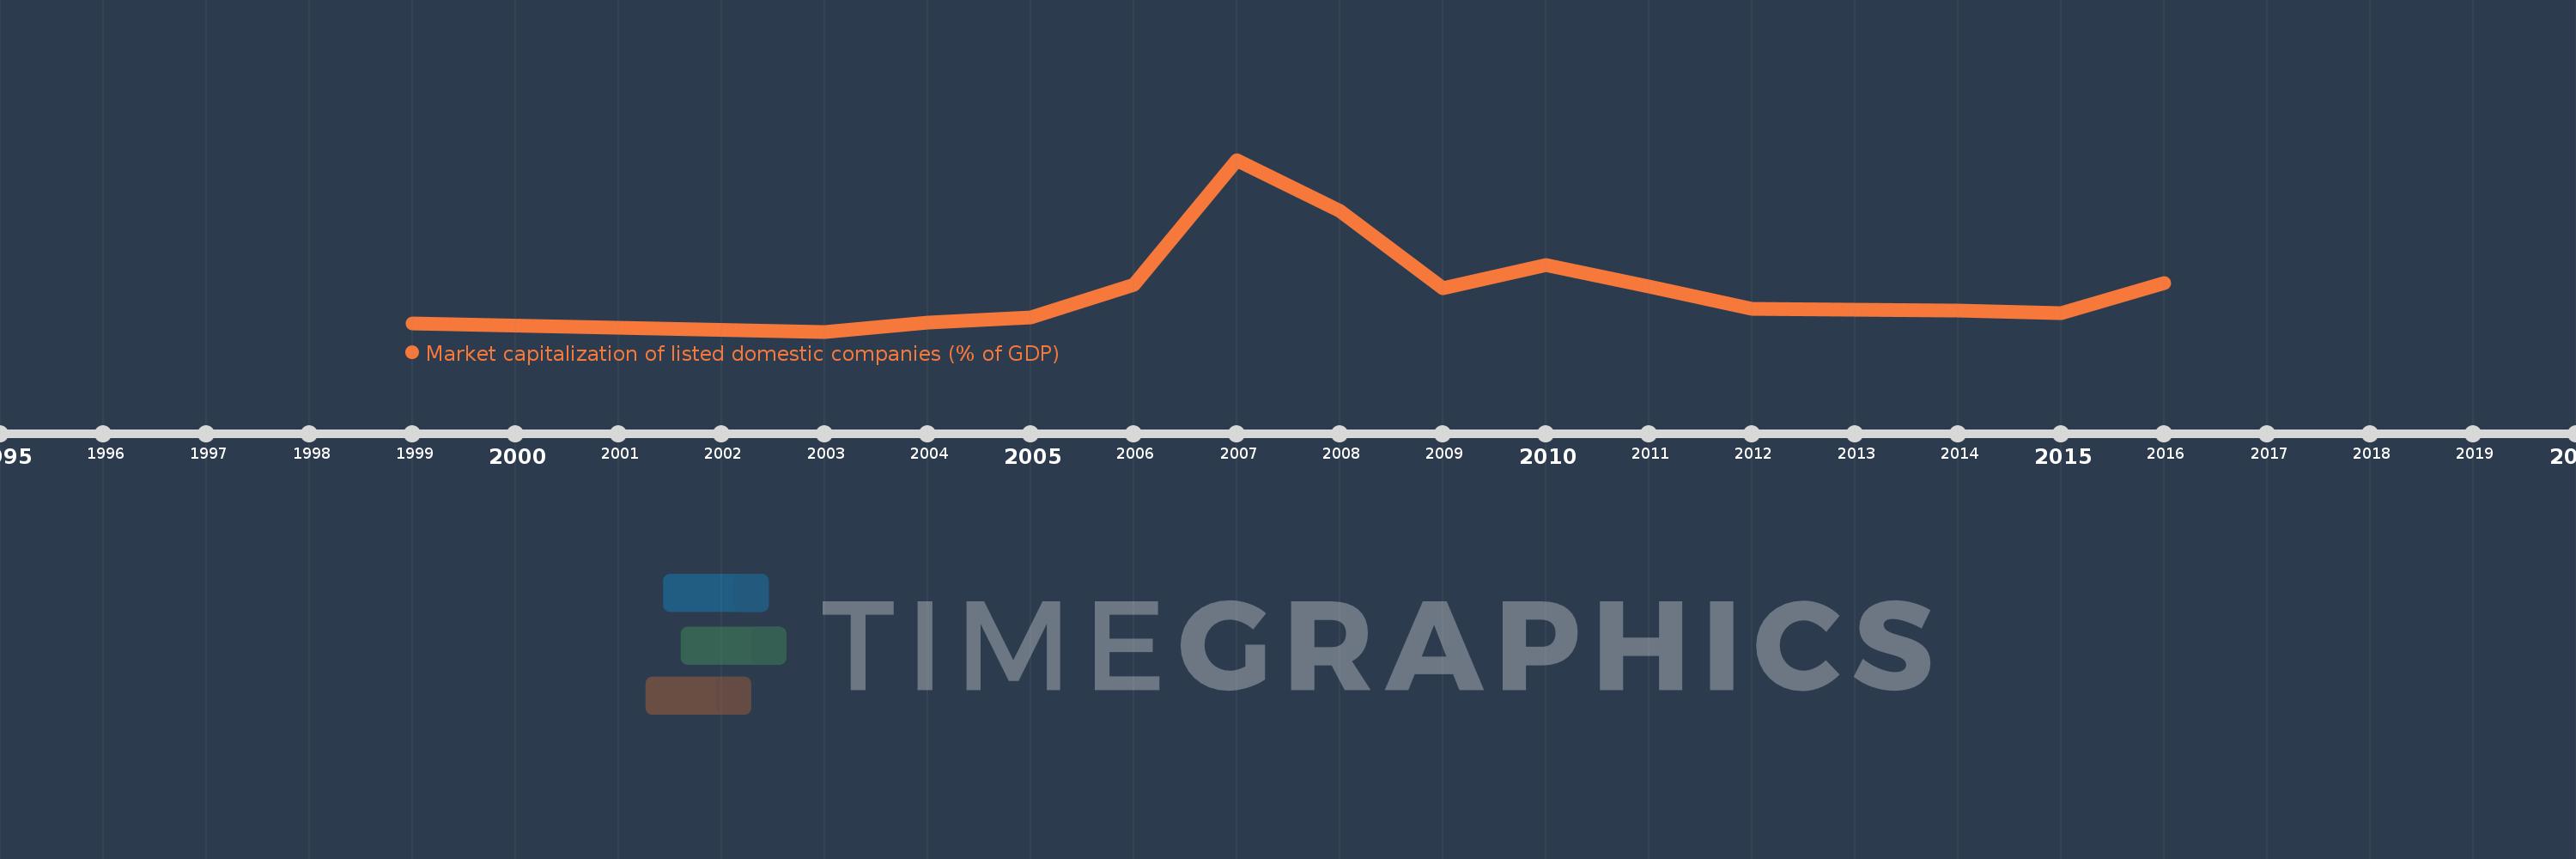
Market capitalization of listed domestic companies (% of GDP)
2016,2015,2014,2012,2011,2010,2009,2008,2007,2006,2005,2004,2003,1999
This statistics in other country:
Timeline:
This timeline shows a graph from 1999 to 2016 of Kazakhstan. No data until 1998. Number of actual observations by date: 14.
Source name:
World Development Indicators
Source organization:
World Federation of Exchanges database.
Categories, topics:
Financial Sector
Last updated:
apr 23, 2017
Indicators value changes by year
Maximum:
53.934
jan 1, 2007
At the date of observation
Value
Absolute change
Change from previous value
jan 1, 1999
7.651
+7.651
0.0%
jan 1, 2003
5.234
-2.418
-31.6%
jan 1, 2004
7.868
+2.634
50.32%
jan 1, 2005
9.135
+1.267
16.11%
jan 1, 2006
18.431
+9.296
101.77%
jan 1, 2007
53.934
+35.502
192.62%
jan 1, 2008
39.464
-14.47
-26.83%
jan 1, 2009
17.44
-22.024
-55.81%
jan 1, 2010
24.221
+6.782
38.89%
jan 1, 2011
18.016
-6.205
-25.62%
jan 1, 2012
11.7
-6.316
-35.06%
jan 1, 2014
11.084
-0.616
-5.27%
jan 1, 2015
10.376
-0.708
-6.39%
jan 1, 2016
18.923
+8.547
82.38%
Ranking of countries by current statistics by years


Comments: