29
/
en
AIzaSyAYiBZKx7MnpbEhh9jyipgxe19OcubqV5w
April 1, 2024
83931
Benin
BEN
true
2
1
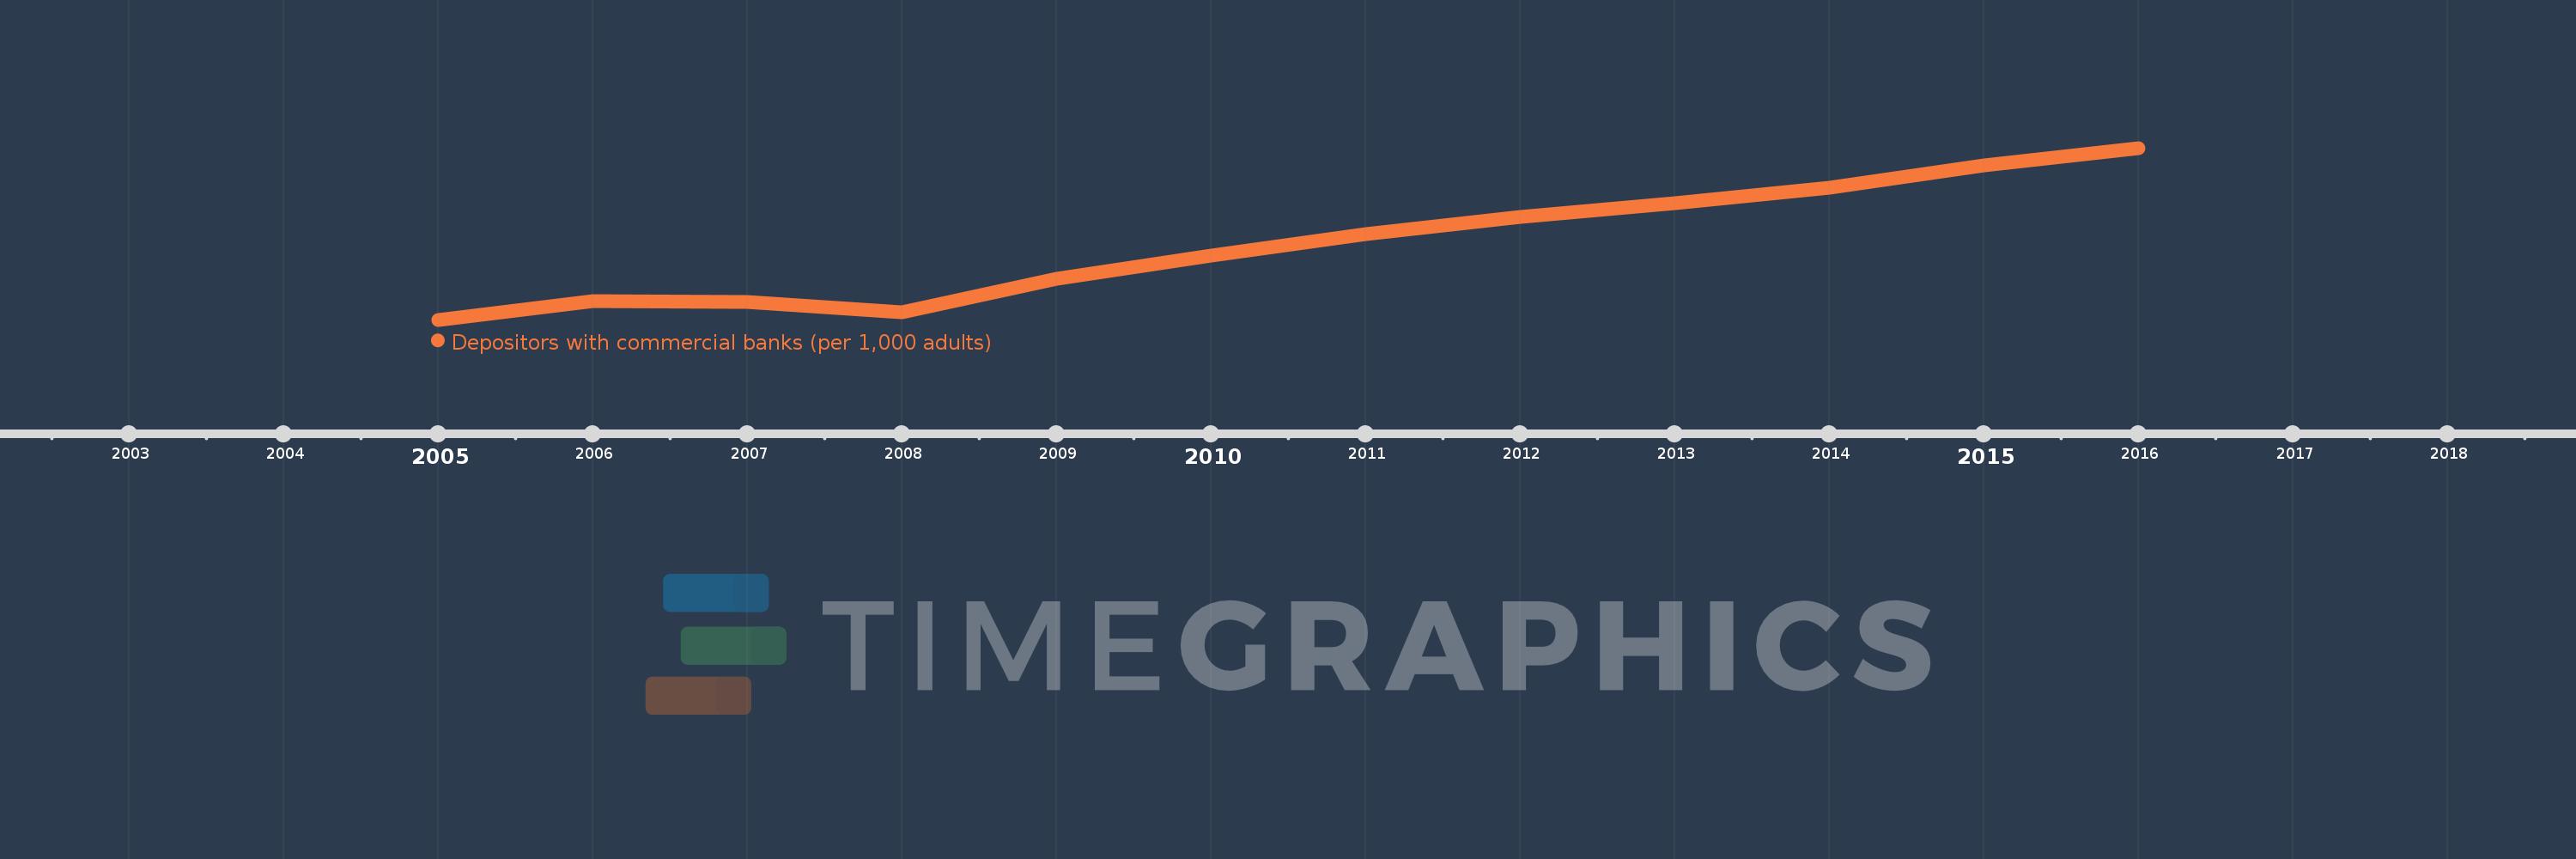
Depositors with commercial banks (per 1,000 adults)
2016,2015,2014,2013,2012,2011,2010,2009,2008,2007,2006,2005
This statistics in other country:
Timeline:
This timeline shows a graph from 2005 to 2016 of Benin. No data until 2004. Number of actual observations by date: 12.
Source name:
World Development Indicators
Source organization:
International Monetary Fund, Financial Access Survey.
Categories, topics:
Financial Sector
Last updated:
apr 23, 2017
Indicators value changes by year
Minimum:
45.807
jan 1, 2005
Maximum:
167.822
jan 1, 2016
At the date of observation
Value
Absolute change
Change from previous value
jan 1, 2005
45.807
+45.807
0.0%
jan 1, 2006
58.862
+13.056
28.5%
jan 1, 2007
58.398
-0.465
-0.79%
jan 1, 2008
50.915
-7.483
-12.81%
jan 1, 2009
74.723
+23.808
46.76%
jan 1, 2010
91.631
+16.908
22.63%
jan 1, 2011
106.49
+14.859
16.22%
jan 1, 2012
118.903
+12.413
11.66%
jan 1, 2013
128.414
+9.512
8.0%
jan 1, 2014
139.819
+11.404
8.88%
jan 1, 2015
155.368
+15.549
11.12%
jan 1, 2016
167.822
+12.454
8.02%
Ranking of countries by current statistics by years


Comments: