29
/
en
AIzaSyAYiBZKx7MnpbEhh9jyipgxe19OcubqV5w
April 1, 2024
188885
Maldives
MDV
true
2
1
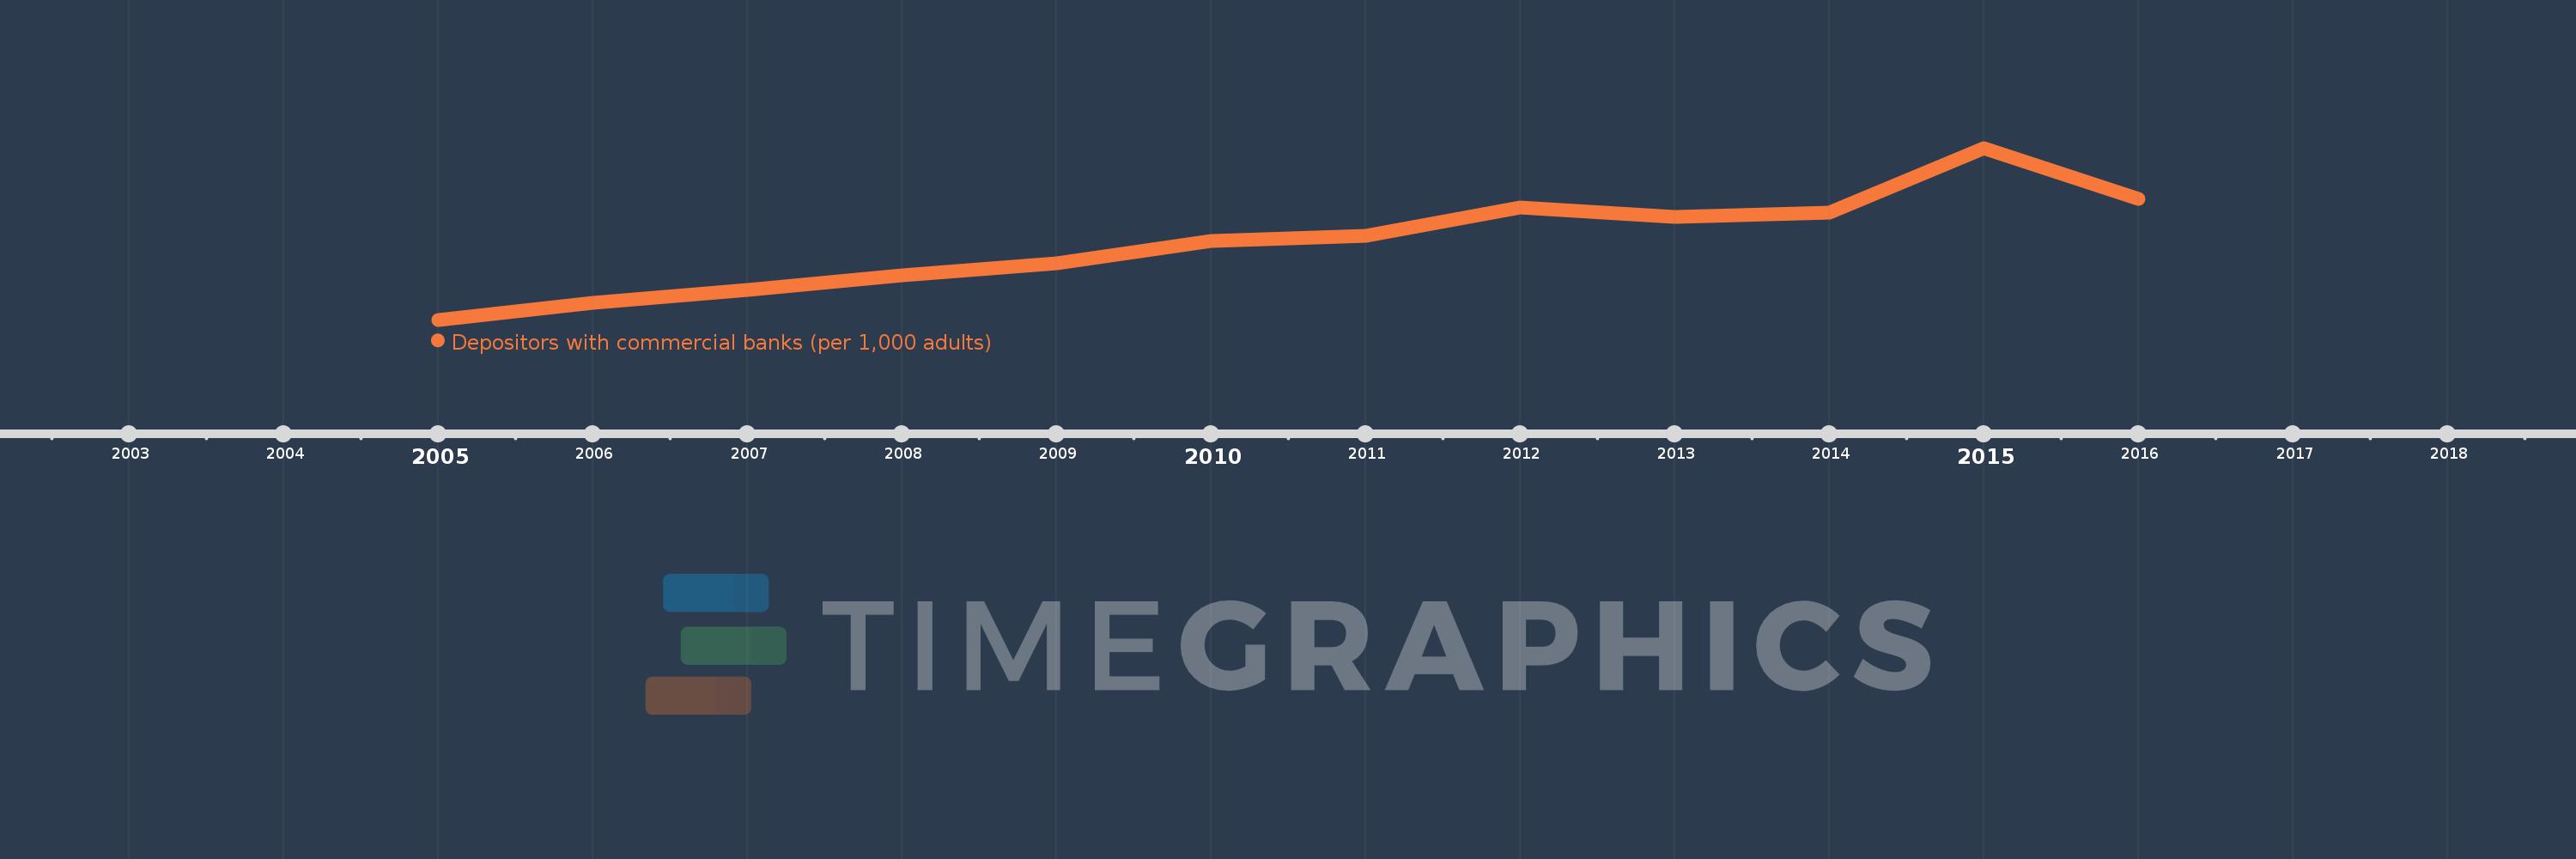
Depositors with commercial banks (per 1,000 adults)
2016,2015,2014,2013,2012,2011,2010,2009,2008,2007,2006,2005
This statistics in other country:
Timeline:
This timeline shows a graph from 2005 to 2016 of Maldives. No data until 2004. Number of actual observations by date: 12.
Source name:
World Development Indicators
Source organization:
International Monetary Fund, Financial Access Survey.
Categories, topics:
Financial Sector
Last updated:
apr 23, 2017
Indicators value changes by year
Minimum:
657.377
jan 1, 2005
Maximum:
1.402K
jan 1, 2015
At the date of observation
Value
Absolute change
Change from previous value
jan 1, 2005
657.377
+657.377
0.0%
jan 1, 2006
732.173
+74.796
11.38%
jan 1, 2007
784.757
+52.584
7.18%
jan 1, 2008
848.256
+63.499
8.09%
jan 1, 2009
900.503
+52.248
6.16%
jan 1, 2010
998.52
+98.016
10.88%
jan 1, 2011
1.022K
+23.566
2.36%
jan 1, 2012
1.143K
+121.312
11.87%
jan 1, 2013
1.101K
-41.988
-3.67%
jan 1, 2014
1.123K
+21.641
1.96%
jan 1, 2015
1.402K
+279.004
24.84%
jan 1, 2016
1.18K
-222.321
-15.86%
Ranking of countries by current statistics by years


Comments: