29
/
en
AIzaSyAYiBZKx7MnpbEhh9jyipgxe19OcubqV5w
April 1, 2024
58829
Sub-Saharan Africa
SSF
false
2
1
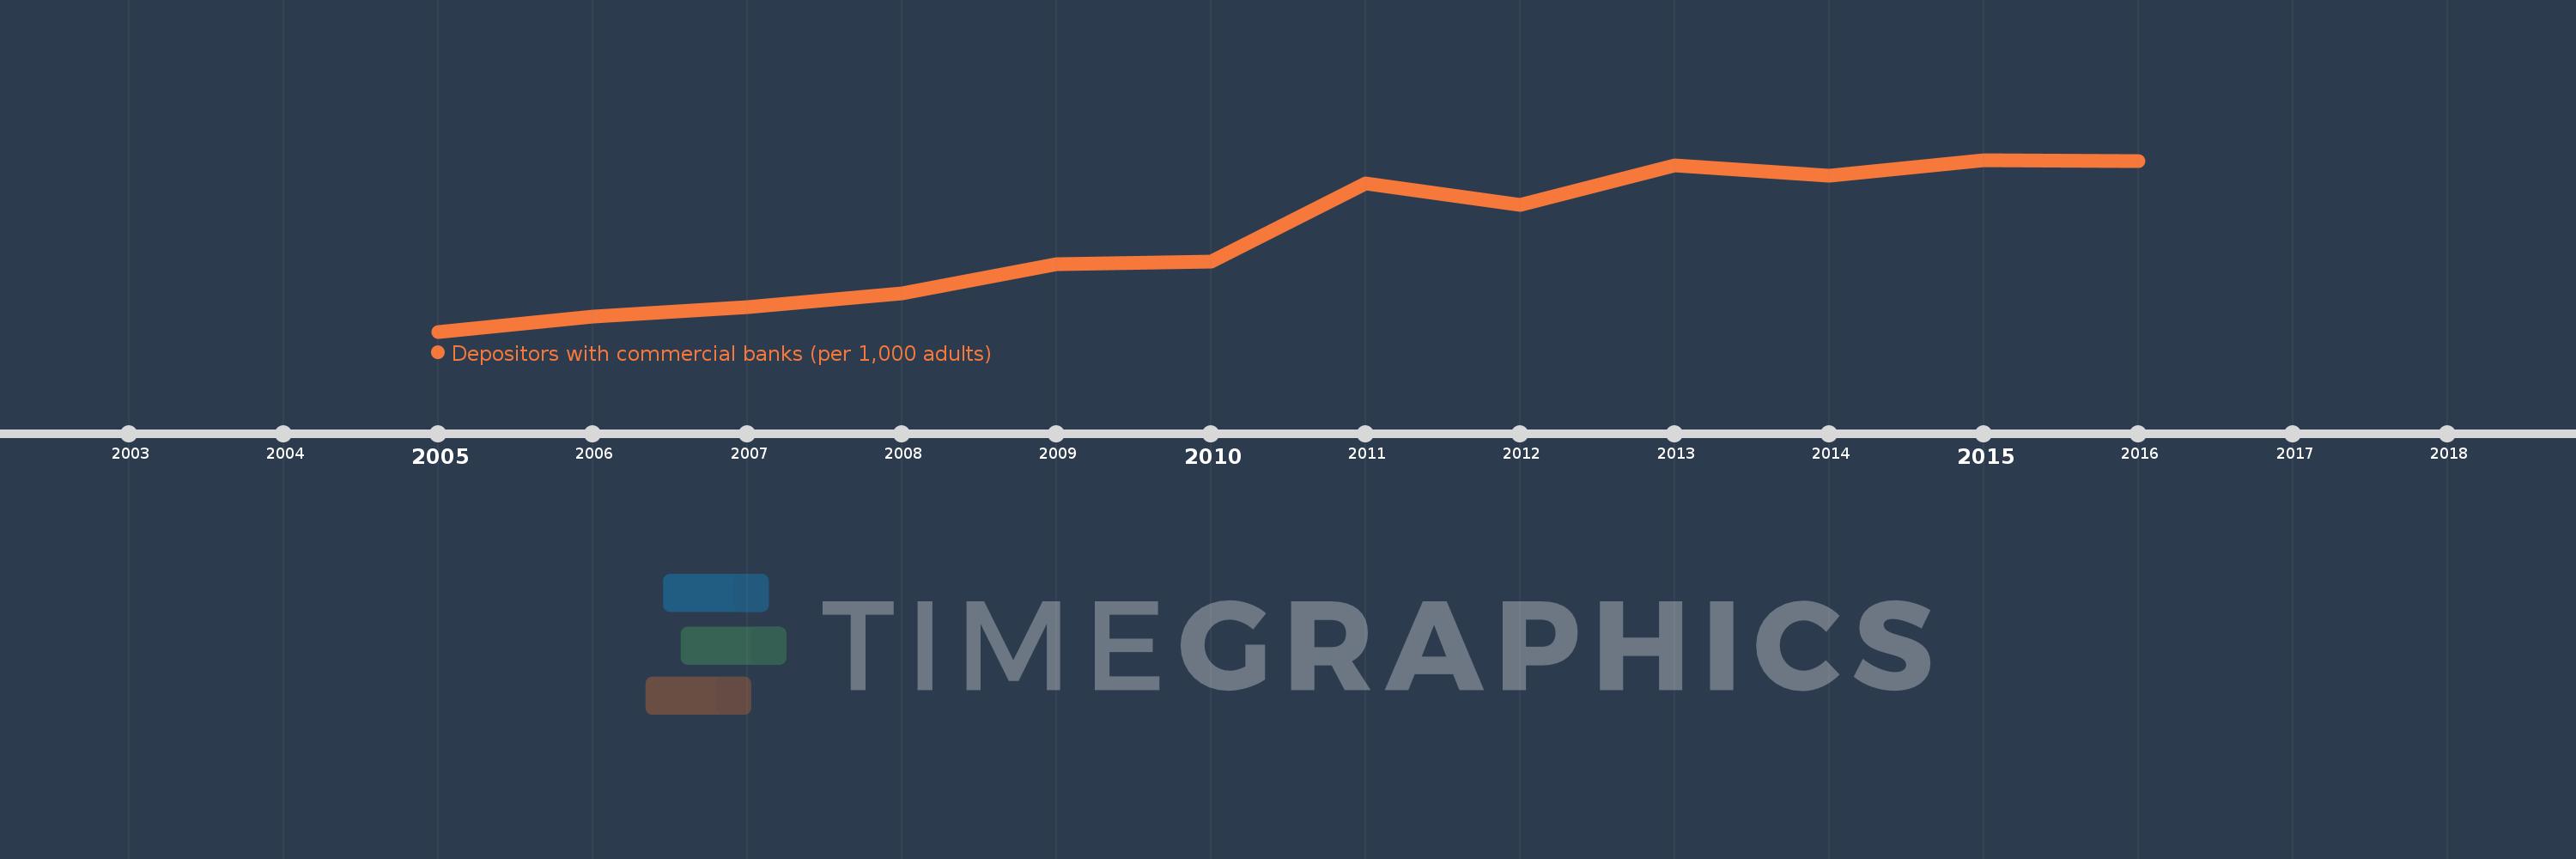
Depositors with commercial banks (per 1,000 adults)
2016,2015,2014,2013,2012,2011,2010,2009,2008,2007,2006,2005
This statistics in other country:
Timeline:
This timeline shows a graph from 2005 to 2016 of Sub-Saharan Africa . No data until 2004. Number of actual observations by date: 12.
Source name:
World Development Indicators
Source organization:
International Monetary Fund, Financial Access Survey.
Categories, topics:
Financial Sector
Last updated:
apr 23, 2017
Indicators value changes by year
Minimum:
49.998
jan 1, 2005
Maximum:
155.368
jan 1, 2015
At the date of observation
Value
Absolute change
Change from previous value
jan 1, 2005
49.998
+49.998
0.0%
jan 1, 2006
59.021
+9.023
18.05%
jan 1, 2007
64.809
+5.788
9.81%
jan 1, 2008
73.631
+8.822
13.61%
jan 1, 2009
91.563
+17.932
24.35%
jan 1, 2010
92.719
+1.156
1.26%
jan 1, 2011
140.815
+48.096
51.87%
jan 1, 2012
127.52
-13.296
-9.44%
jan 1, 2013
152.196
+24.676
19.35%
jan 1, 2014
145.42
-6.776
-4.45%
jan 1, 2015
155.368
+9.948
6.84%
jan 1, 2016
154.796
-0.572
-0.37%
Ranking of countries by current statistics by years


Comments: