29
/
en
AIzaSyAYiBZKx7MnpbEhh9jyipgxe19OcubqV5w
April 1, 2024
146730
Guinea-Bissau
GNB
true
2
1
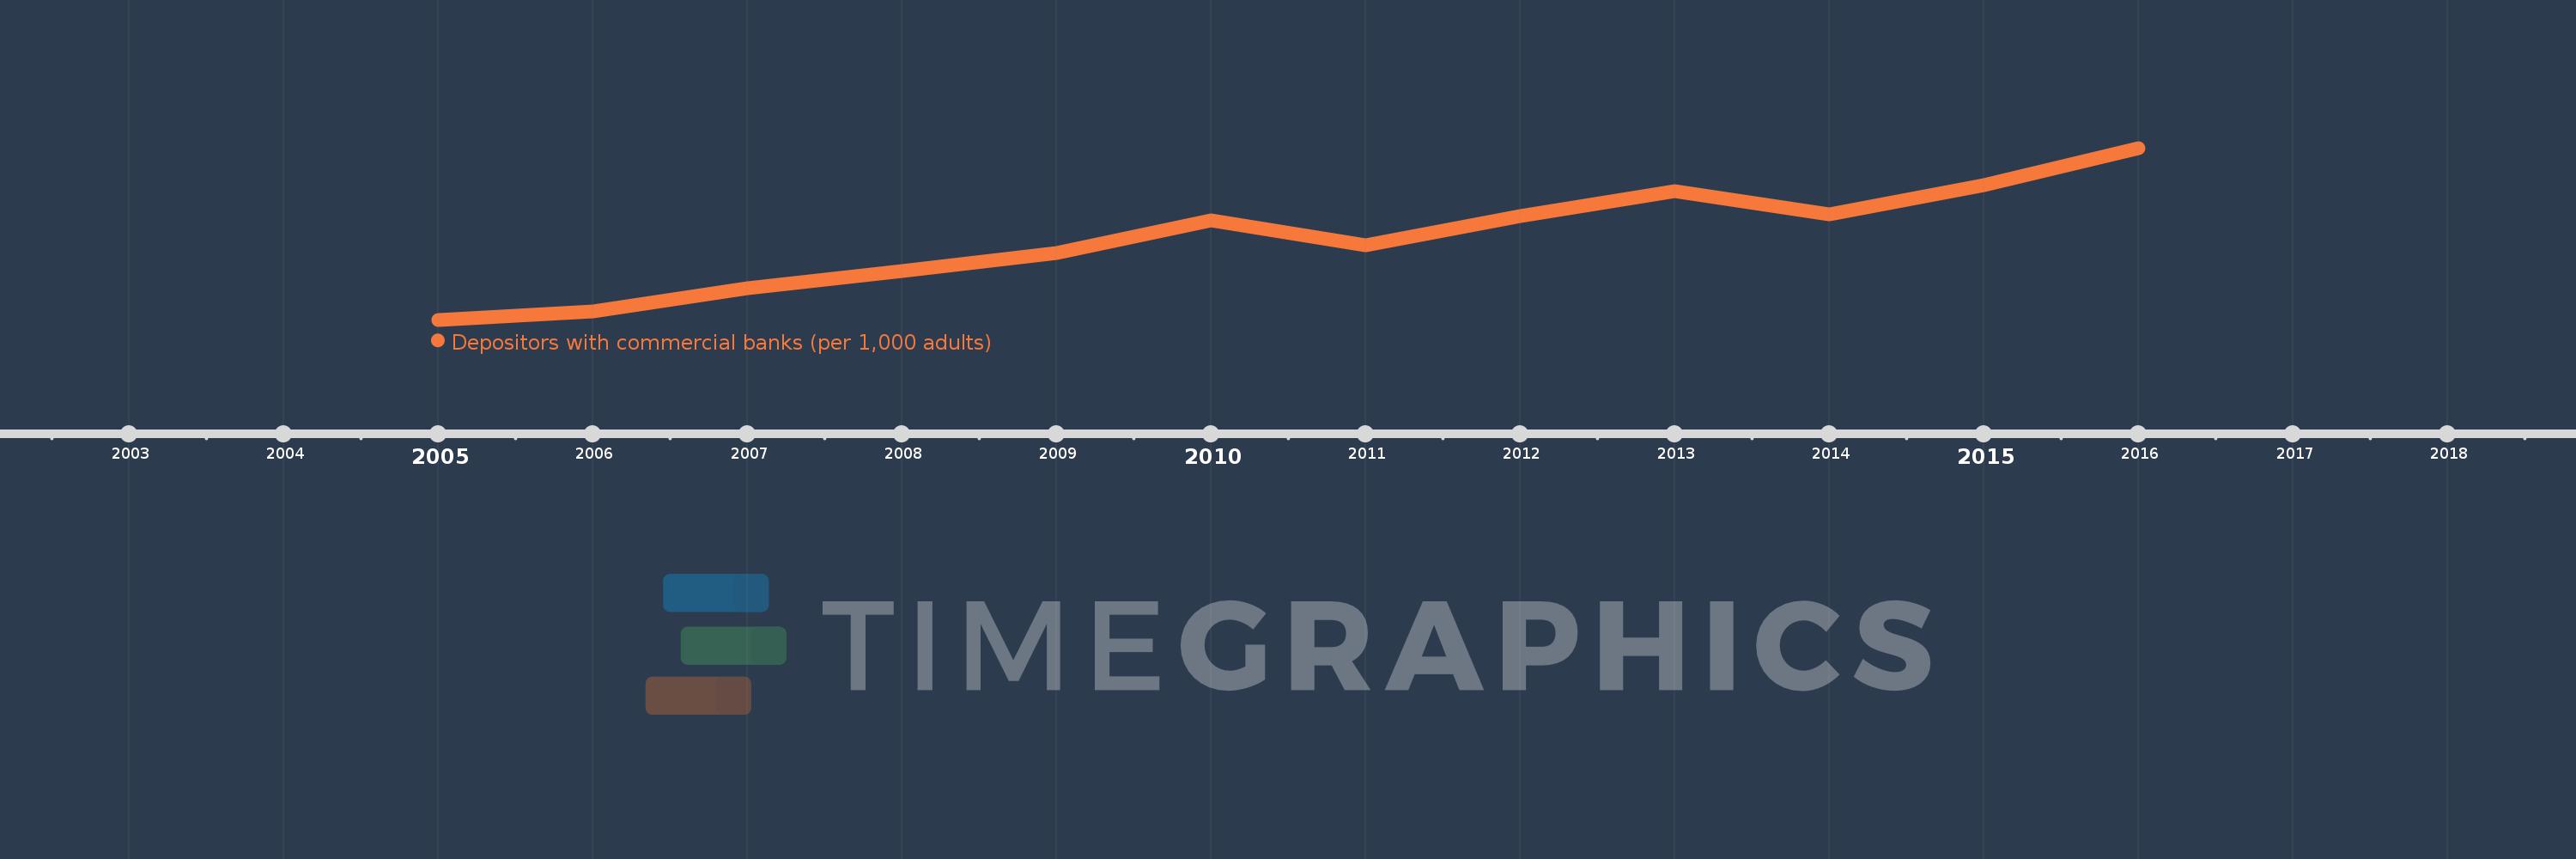
Depositors with commercial banks (per 1,000 adults)
2016,2015,2014,2013,2012,2011,2010,2009,2008,2007,2006,2005
This statistics in other country:
Timeline:
This timeline shows a graph from 2005 to 2016 of Guinea-Bissau. No data until 2004. Number of actual observations by date: 12.
Source name:
World Development Indicators
Source organization:
International Monetary Fund, Financial Access Survey.
Categories, topics:
Financial Sector
Last updated:
apr 23, 2017
Indicators value changes by year
Maximum:
89.461
jan 1, 2016
At the date of observation
Value
Absolute change
Change from previous value
jan 1, 2005
8.496
+8.496
0.0%
jan 1, 2006
12.352
+3.856
45.39%
jan 1, 2007
23.207
+10.855
87.88%
jan 1, 2008
31.404
+8.196
35.32%
jan 1, 2009
40.092
+8.688
27.67%
jan 1, 2010
55.443
+15.352
38.29%
jan 1, 2011
43.498
-11.945
-21.54%
jan 1, 2012
57.223
+13.724
31.55%
jan 1, 2013
69.077
+11.855
20.72%
jan 1, 2014
58.103
-10.975
-15.89%
jan 1, 2015
71.992
+13.889
23.9%
jan 1, 2016
89.461
+17.469
24.27%
Ranking of countries by current statistics by years


Comments: