29
/
en
AIzaSyAYiBZKx7MnpbEhh9jyipgxe19OcubqV5w
April 1, 2024
129199
Estonia
EST
true
2
1
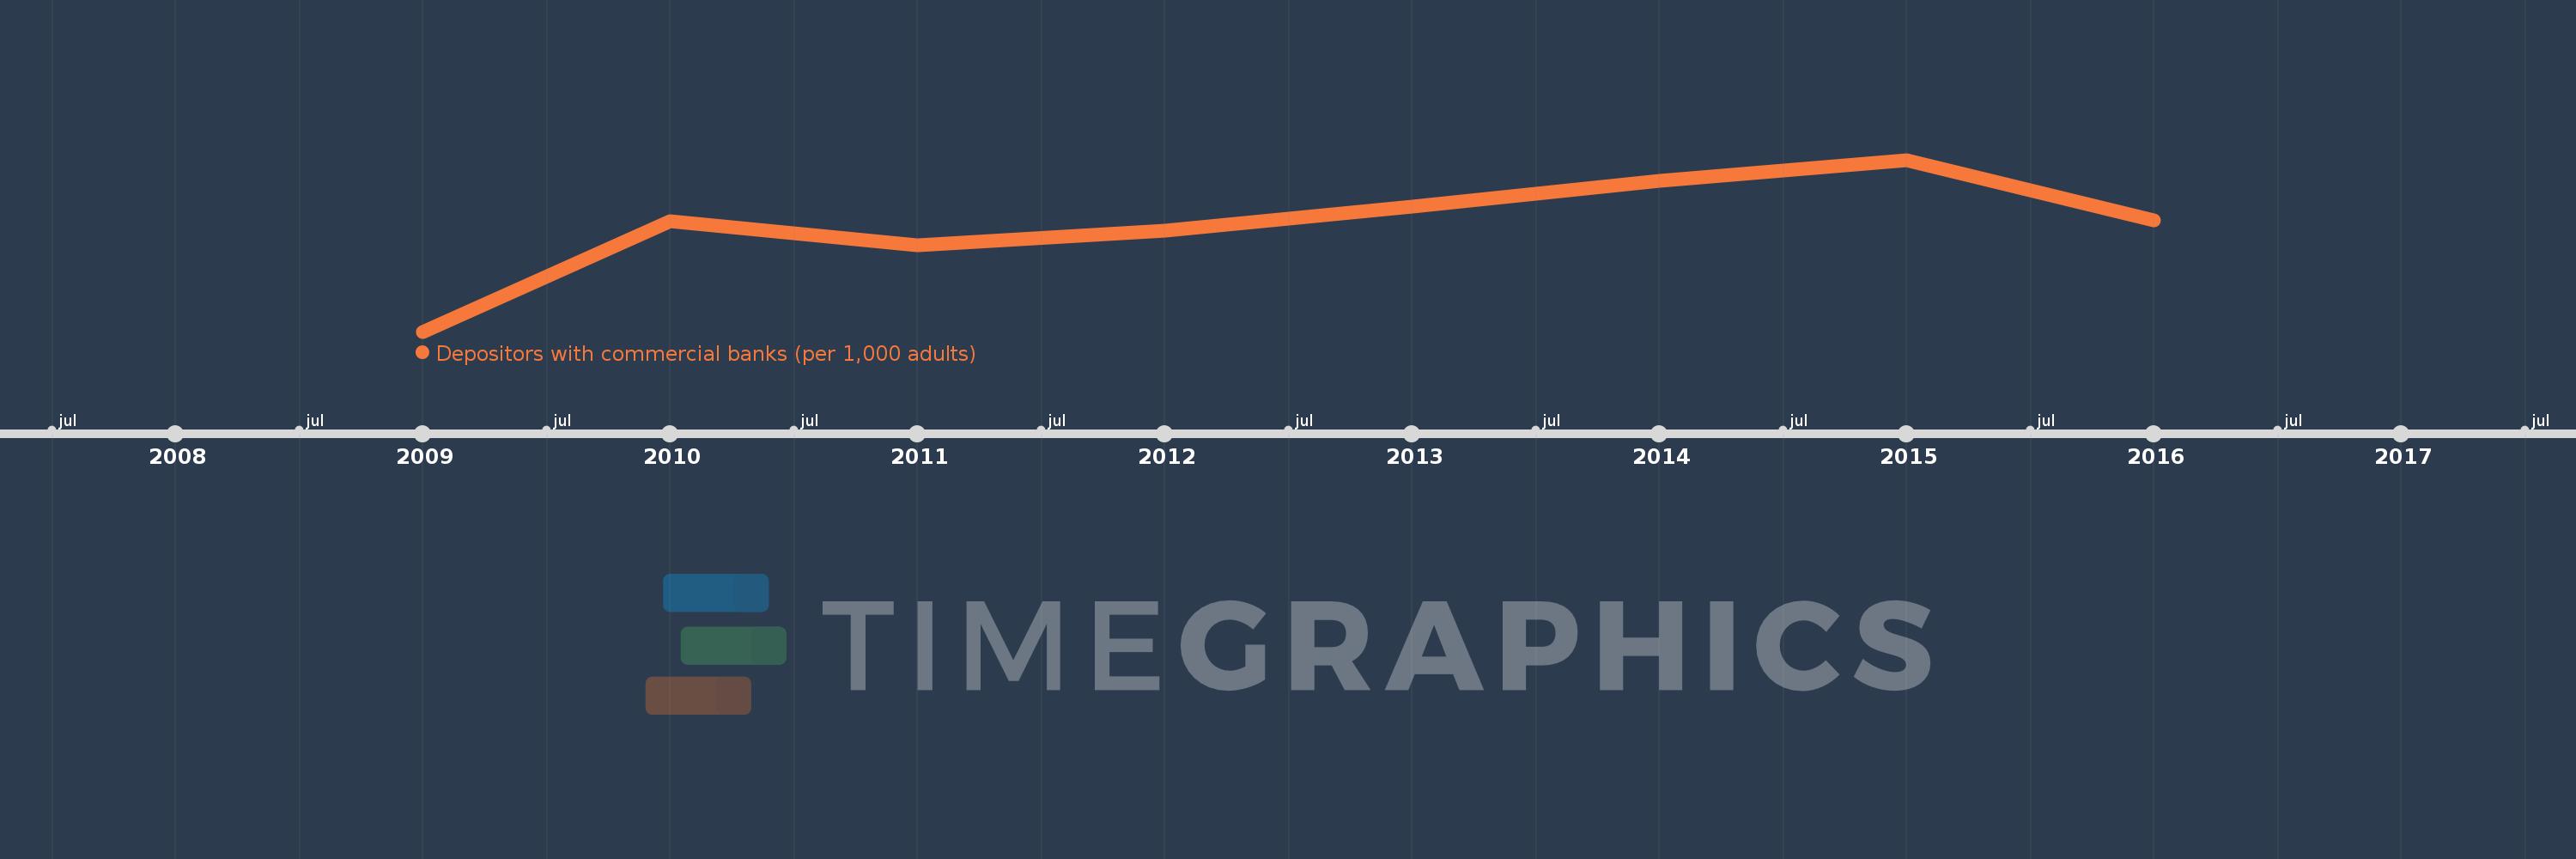
Depositors with commercial banks (per 1,000 adults)
2016,2015,2014,2013,2012,2011,2010,2009
This statistics in other country:
Timeline:
This timeline shows a graph from 2009 to 2016 of Estonia. No data until 2008. Number of actual observations by date: 8.
Source name:
World Development Indicators
Source organization:
International Monetary Fund, Financial Access Survey.
Categories, topics:
Financial Sector
Last updated:
apr 23, 2017
Indicators value changes by year
Minimum:
1.699K
jan 1, 2009
Maximum:
2.312K
jan 1, 2015
At the date of observation
Value
Absolute change
Change from previous value
jan 1, 2009
1.699K
+1.699K
0.0%
jan 1, 2010
2.094K
+395.847
23.3%
jan 1, 2011
2.006K
-88.55
-4.23%
jan 1, 2012
2.058K
+52.56
2.62%
jan 1, 2013
2.145K
+86.473
4.2%
jan 1, 2014
2.237K
+92.478
4.31%
jan 1, 2015
2.312K
+75.028
3.35%
jan 1, 2016
2.097K
-215.695
-9.33%
Ranking of countries by current statistics by years


Comments: