29
/
en
AIzaSyAYiBZKx7MnpbEhh9jyipgxe19OcubqV5w
April 1, 2024
227274
Qatar
QAT
true
2
1
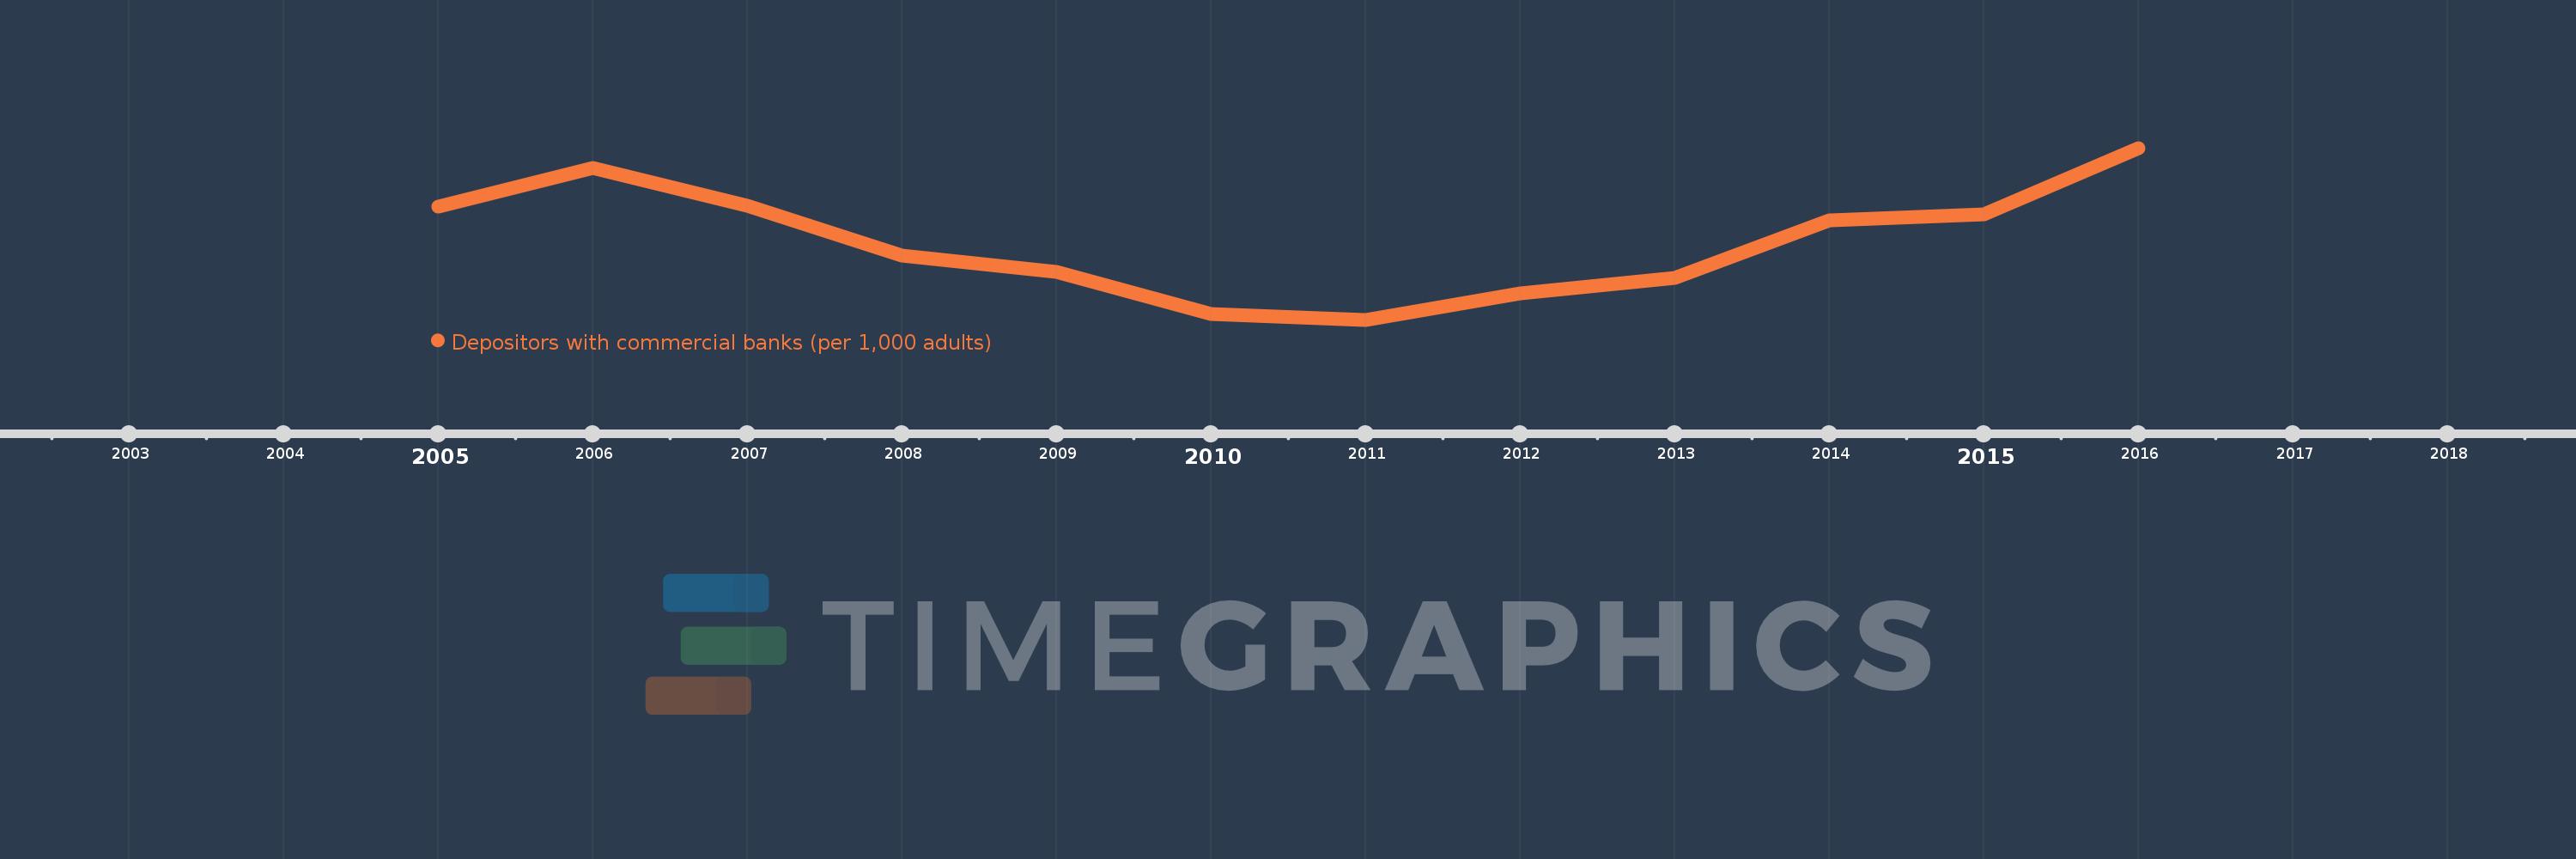
Depositors with commercial banks (per 1,000 adults)
2016,2015,2014,2013,2012,2011,2010,2009,2008,2007,2006,2005
This statistics in other country:
Timeline:
This timeline shows a graph from 2005 to 2016 of Qatar. No data until 2004. Number of actual observations by date: 12.
Source name:
World Development Indicators
Source organization:
International Monetary Fund, Financial Access Survey.
Categories, topics:
Financial Sector
Last updated:
apr 23, 2017
Indicators value changes by year
Minimum:
596.543
jan 1, 2011
Maximum:
783.955
jan 1, 2016
At the date of observation
Value
Absolute change
Change from previous value
jan 1, 2005
719.734
+719.734
0.0%
jan 1, 2006
762.311
+42.576
5.92%
jan 1, 2007
720.624
-41.687
-5.47%
jan 1, 2008
666.521
-54.103
-7.51%
jan 1, 2009
648.934
-17.587
-2.64%
jan 1, 2010
602.397
-46.537
-7.17%
jan 1, 2011
596.543
-5.854
-0.97%
jan 1, 2012
625.234
+28.691
4.81%
jan 1, 2013
642.499
+17.265
2.76%
jan 1, 2014
705.425
+62.926
9.79%
jan 1, 2015
711.35
+5.924
0.84%
jan 1, 2016
783.955
+72.606
10.21%
Ranking of countries by current statistics by years


Comments: