29
/
en
AIzaSyAYiBZKx7MnpbEhh9jyipgxe19OcubqV5w
April 1, 2024
38052
IDA blend
IDB
false
2
1
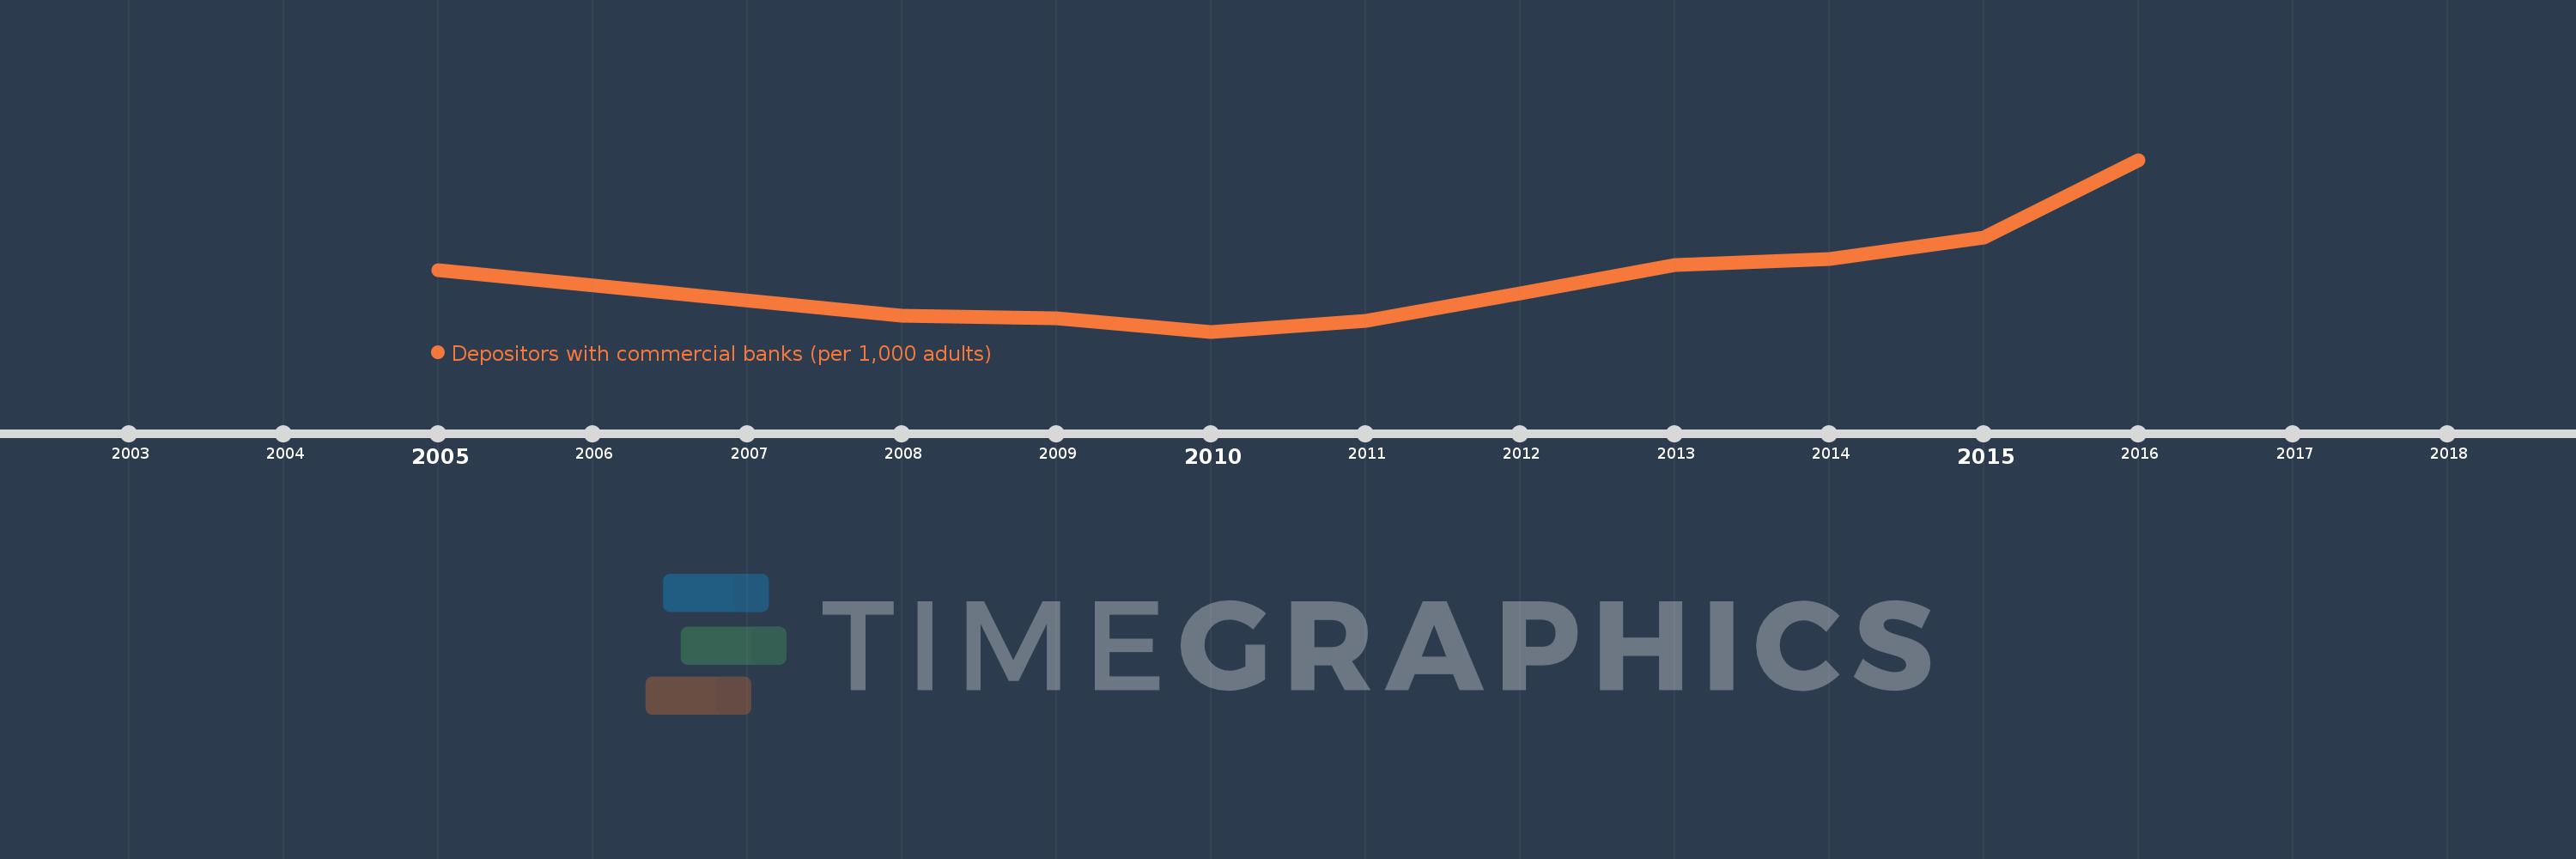
Depositors with commercial banks (per 1,000 adults)
2016,2015,2014,2013,2012,2011,2010,2009,2008,2005
This statistics in other country:
Timeline:
This timeline shows a graph from 2005 to 2016 of IDA blend. No data until 2004. Number of actual observations by date: 10.
Source name:
World Development Indicators
Source organization:
International Monetary Fund, Financial Access Survey.
Categories, topics:
Financial Sector
Last updated:
apr 23, 2017
Indicators value changes by year
Minimum:
175.297
jan 1, 2010
Maximum:
548.44
jan 1, 2016
At the date of observation
Value
Absolute change
Change from previous value
jan 1, 2005
308.753
+308.753
0.0%
jan 1, 2008
209.135
-99.618
-32.26%
jan 1, 2009
204.474
-4.66
-2.23%
jan 1, 2010
175.297
-29.177
-14.27%
jan 1, 2011
198.171
+22.874
13.05%
jan 1, 2012
257.562
+59.392
29.97%
jan 1, 2013
320.513
+62.951
24.44%
jan 1, 2014
333.302
+12.789
3.99%
jan 1, 2015
378.708
+45.407
13.62%
jan 1, 2016
548.44
+169.732
44.82%
Ranking of countries by current statistics by years


Comments: