29
/
en
AIzaSyAYiBZKx7MnpbEhh9jyipgxe19OcubqV5w
April 1, 2024
212817
Nigeria
NGA
true
2
1
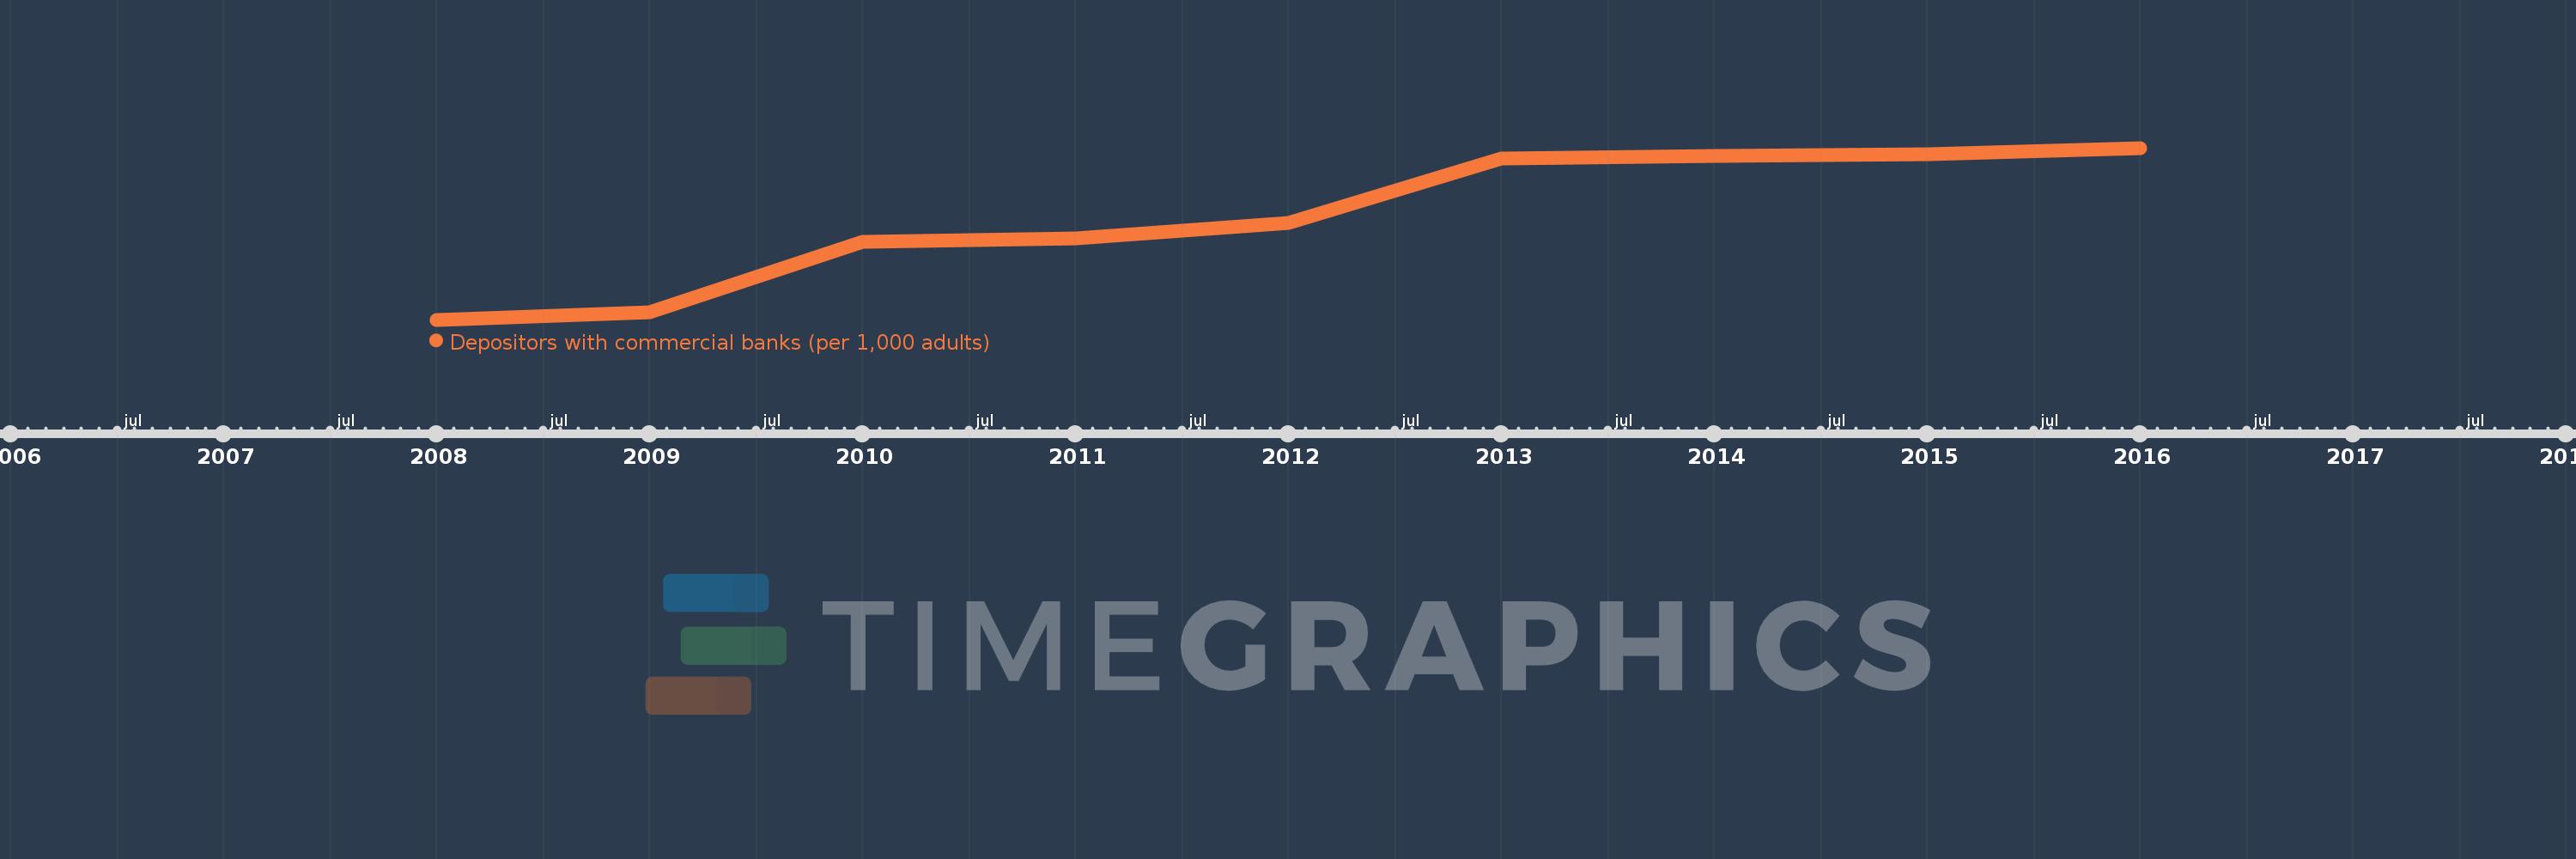
Depositors with commercial banks (per 1,000 adults)
2016,2015,2014,2013,2012,2011,2010,2009,2008
This statistics in other country:
Timeline:
This timeline shows a graph from 2008 to 2016 of Nigeria. No data until 2007. Number of actual observations by date: 9.
Source name:
World Development Indicators
Source organization:
International Monetary Fund, Financial Access Survey.
Categories, topics:
Financial Sector
Last updated:
apr 23, 2017
Indicators value changes by year
Minimum:
294.005
jan 1, 2008
Maximum:
661.89
jan 1, 2016
At the date of observation
Value
Absolute change
Change from previous value
jan 1, 2008
294.005
+294.005
0.0%
jan 1, 2009
309.536
+15.531
5.28%
jan 1, 2010
460.955
+151.419
48.92%
jan 1, 2011
468.979
+8.024
1.74%
jan 1, 2012
500.605
+31.626
6.74%
jan 1, 2013
639.219
+138.614
27.69%
jan 1, 2014
645.333
+6.114
0.96%
jan 1, 2015
647.924
+2.591
0.4%
jan 1, 2016
661.89
+13.966
2.16%
Ranking of countries by current statistics by years


Comments: