29
/
en
AIzaSyAYiBZKx7MnpbEhh9jyipgxe19OcubqV5w
April 1, 2024
34145
Fragile and conflict affected situations
FCS
false
2
1
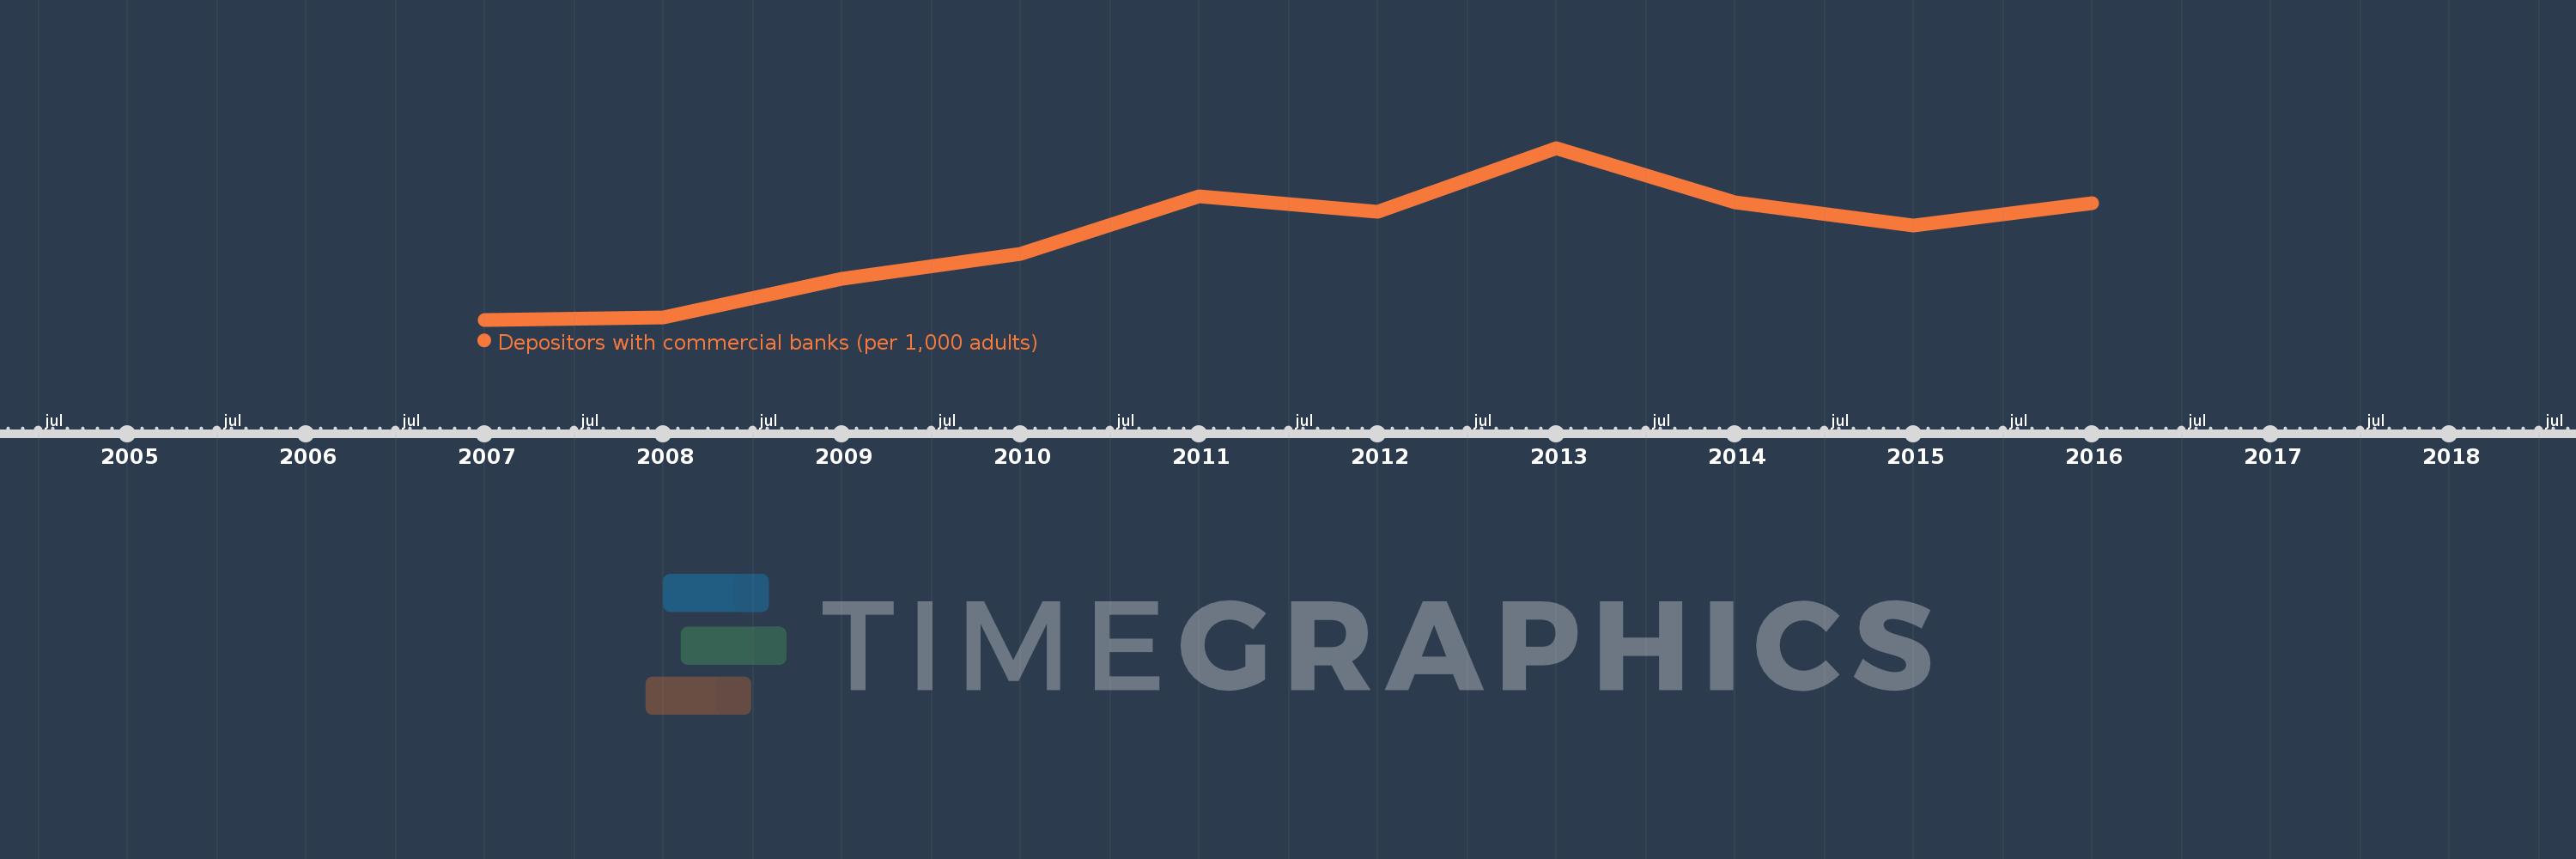
Depositors with commercial banks (per 1,000 adults)
2016,2015,2014,2013,2012,2011,2010,2009,2008,2007
This statistics in other country:
Timeline:
This timeline shows a graph from 2007 to 2016 of Fragile and conflict affected situations. No data until 2006. Number of actual observations by date: 10.
Source name:
World Development Indicators
Source organization:
International Monetary Fund, Financial Access Survey.
Categories, topics:
Financial Sector
Last updated:
apr 23, 2017
Indicators value changes by year
Maximum:
152.196
jan 1, 2013
At the date of observation
Value
Absolute change
Change from previous value
jan 1, 2007
72.62
+72.62
0.0%
jan 1, 2008
73.674
+1.054
1.45%
jan 1, 2009
91.563
+17.889
24.28%
jan 1, 2010
102.939
+11.376
12.42%
jan 1, 2011
129.71
+26.771
26.01%
jan 1, 2012
122.611
-7.1
-5.47%
jan 1, 2013
152.196
+29.585
24.13%
jan 1, 2014
127.055
-25.141
-16.52%
jan 1, 2015
116.106
-10.949
-8.62%
jan 1, 2016
126.507
+10.401
8.96%
Ranking of countries by current statistics by years


Comments: