29
/
en
AIzaSyAYiBZKx7MnpbEhh9jyipgxe19OcubqV5w
April 1, 2024
113449
Cote d'Ivoire
CIV
true
2
1
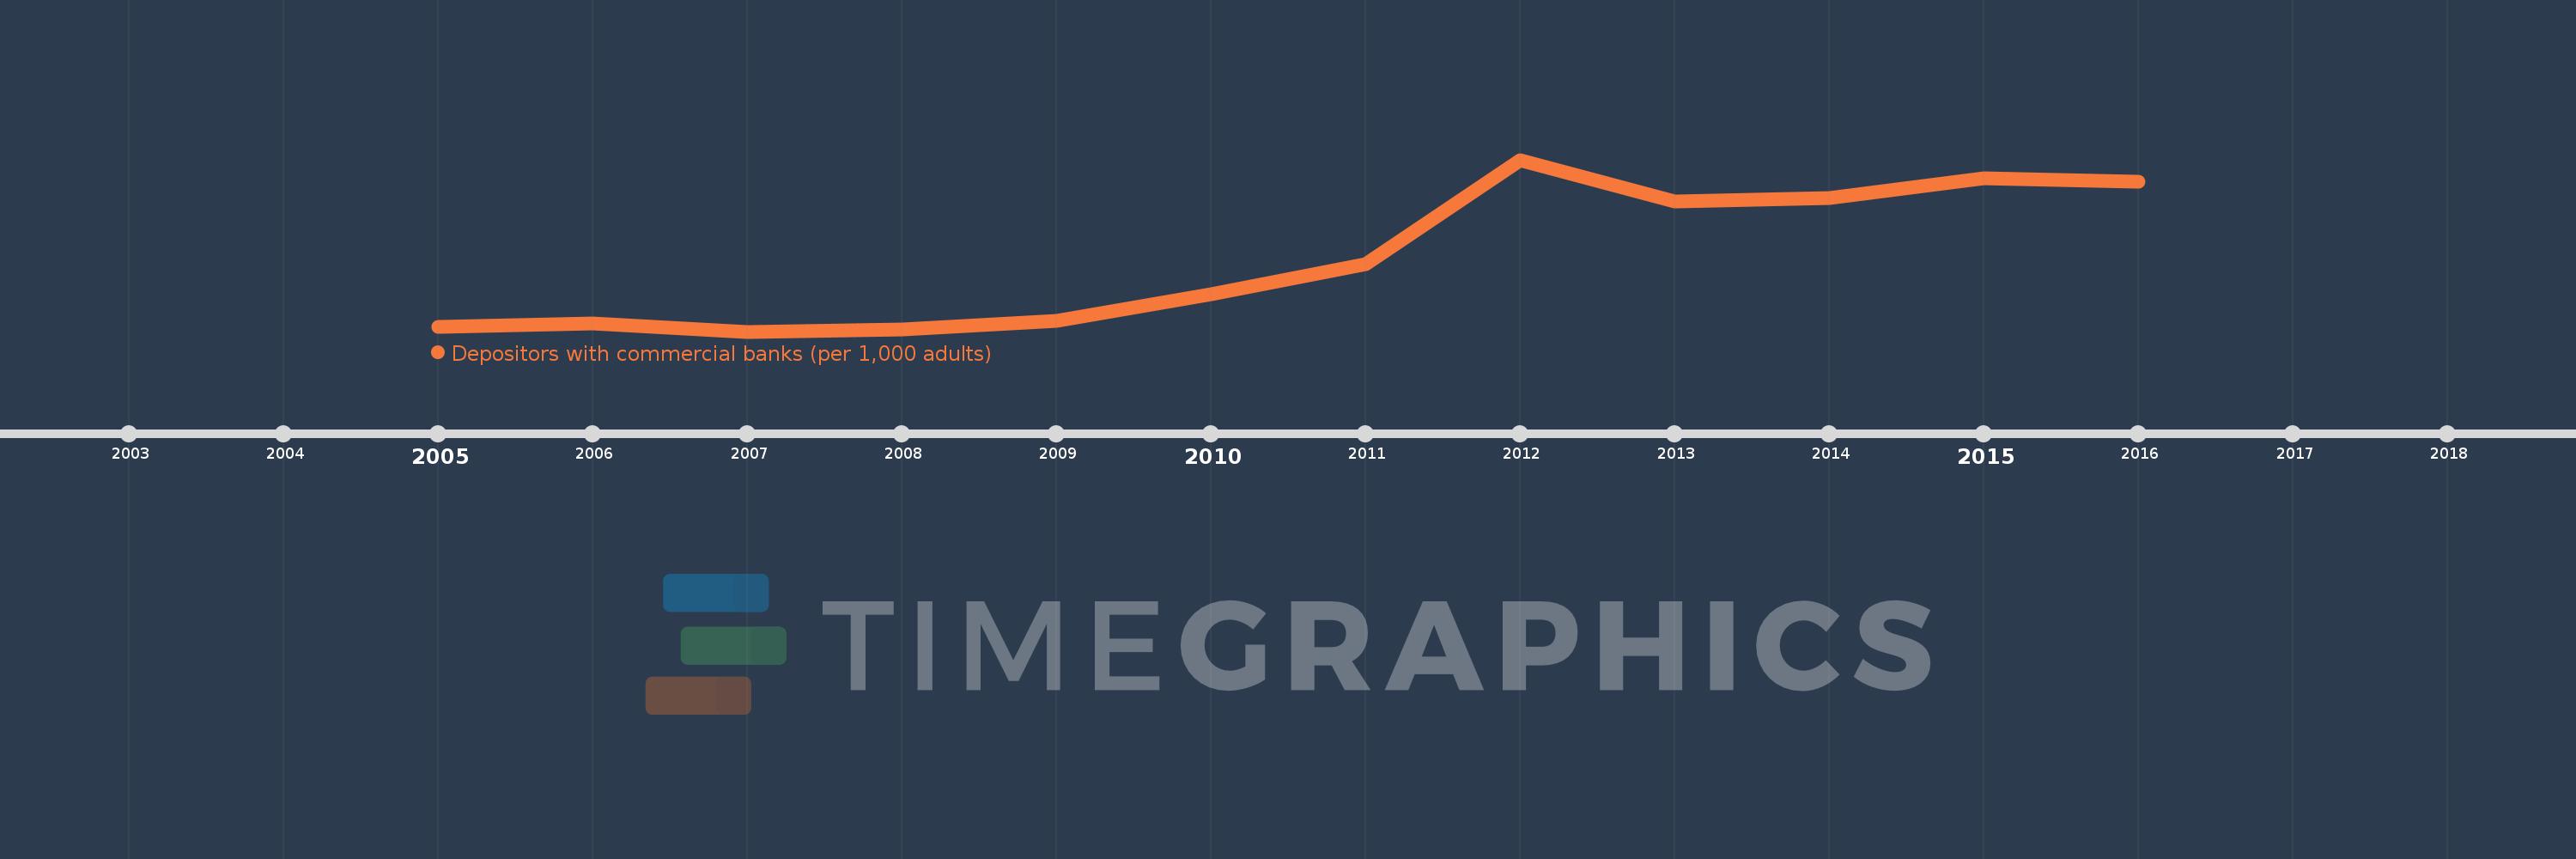
Depositors with commercial banks (per 1,000 adults)
2016,2015,2014,2013,2012,2011,2010,2009,2008,2007,2006,2005
This statistics in other country:
Timeline:
This timeline shows a graph from 2005 to 2016 of Cote d'Ivoire. No data until 2004. Number of actual observations by date: 12.
Source name:
World Development Indicators
Source organization:
International Monetary Fund, Financial Access Survey.
Categories, topics:
Financial Sector
Last updated:
apr 23, 2017
Indicators value changes by year
Minimum:
71.983
jan 1, 2007
Maximum:
218.253
jan 1, 2012
At the date of observation
Value
Absolute change
Change from previous value
jan 1, 2005
76.148
+76.148
0.0%
jan 1, 2006
79.225
+3.077
4.04%
jan 1, 2007
71.983
-7.242
-9.14%
jan 1, 2008
73.631
+1.647
2.29%
jan 1, 2009
81.408
+7.777
10.56%
jan 1, 2010
103.833
+22.425
27.55%
jan 1, 2011
129.71
+25.877
24.92%
jan 1, 2012
218.253
+88.543
68.26%
jan 1, 2013
182.523
-35.731
-16.37%
jan 1, 2014
185.624
+3.101
1.7%
jan 1, 2015
202.758
+17.134
9.23%
jan 1, 2016
199.747
-3.012
-1.49%
Ranking of countries by current statistics by years


Comments: