29
/
en
AIzaSyAYiBZKx7MnpbEhh9jyipgxe19OcubqV5w
April 1, 2024
176239
Lebanon
LBN
true
2
1
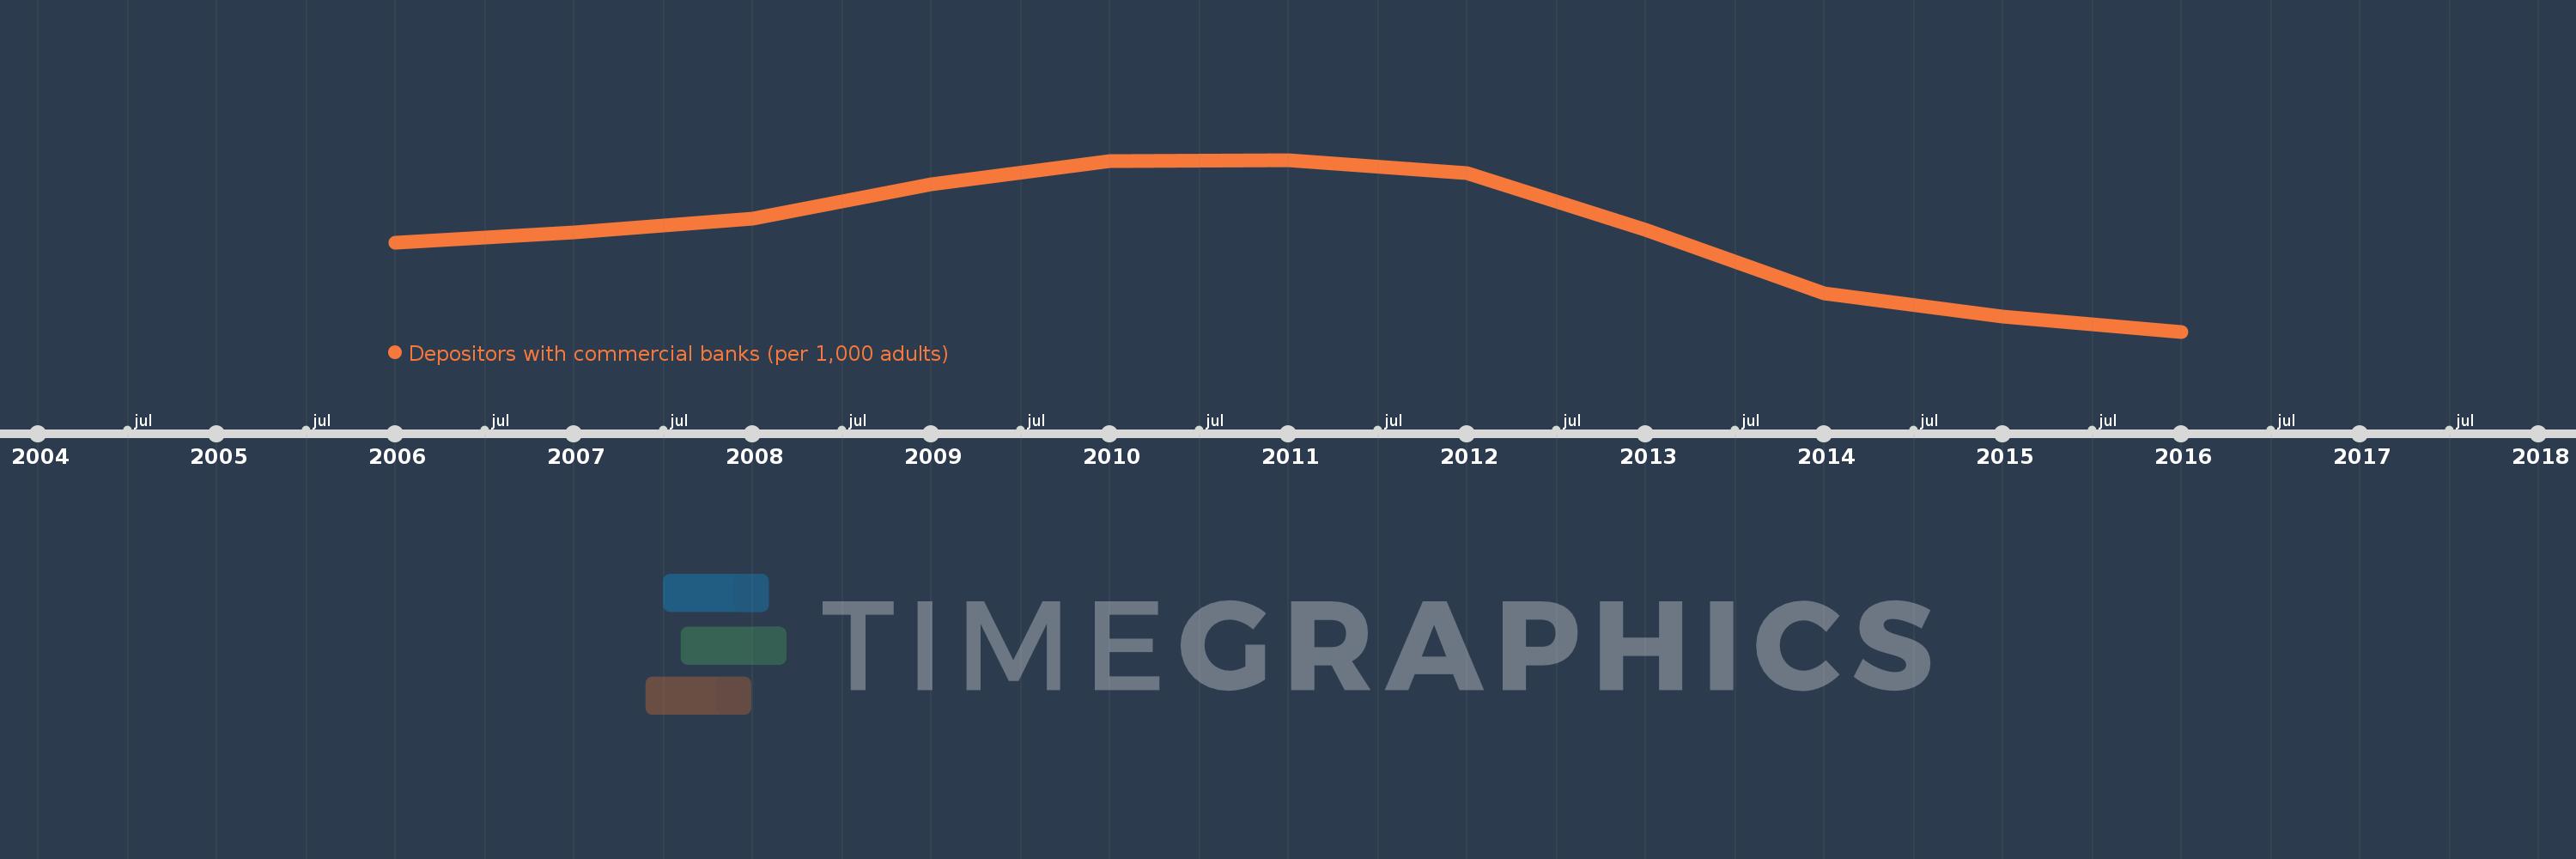
Depositors with commercial banks (per 1,000 adults)
2016,2015,2014,2013,2012,2011,2010,2009,2008,2007,2006
This statistics in other country:
Timeline:
This timeline shows a graph from 2006 to 2016 of Lebanon. No data until 2005. Number of actual observations by date: 11.
Source name:
World Development Indicators
Source organization:
International Monetary Fund, Financial Access Survey.
Categories, topics:
Financial Sector
Last updated:
apr 23, 2017
Indicators value changes by year
Minimum:
652.161
jan 1, 2016
Maximum:
858.992
jan 1, 2011
At the date of observation
Value
Absolute change
Change from previous value
jan 1, 2006
759.538
+759.538
0.0%
jan 1, 2007
771.126
+11.588
1.53%
jan 1, 2008
787.642
+16.515
2.14%
jan 1, 2009
829.564
+41.923
5.32%
jan 1, 2010
857.839
+28.275
3.41%
jan 1, 2011
858.992
+1.153
0.13%
jan 1, 2012
842.695
-16.297
-1.9%
jan 1, 2013
774.464
-68.231
-8.1%
jan 1, 2014
698.369
-76.095
-9.83%
jan 1, 2015
669.743
-28.626
-4.1%
jan 1, 2016
652.161
-17.582
-2.63%
Ranking of countries by current statistics by years


Comments: