29
/
en
AIzaSyAYiBZKx7MnpbEhh9jyipgxe19OcubqV5w
April 1, 2024
160339
Israel
ISR
true
2
1
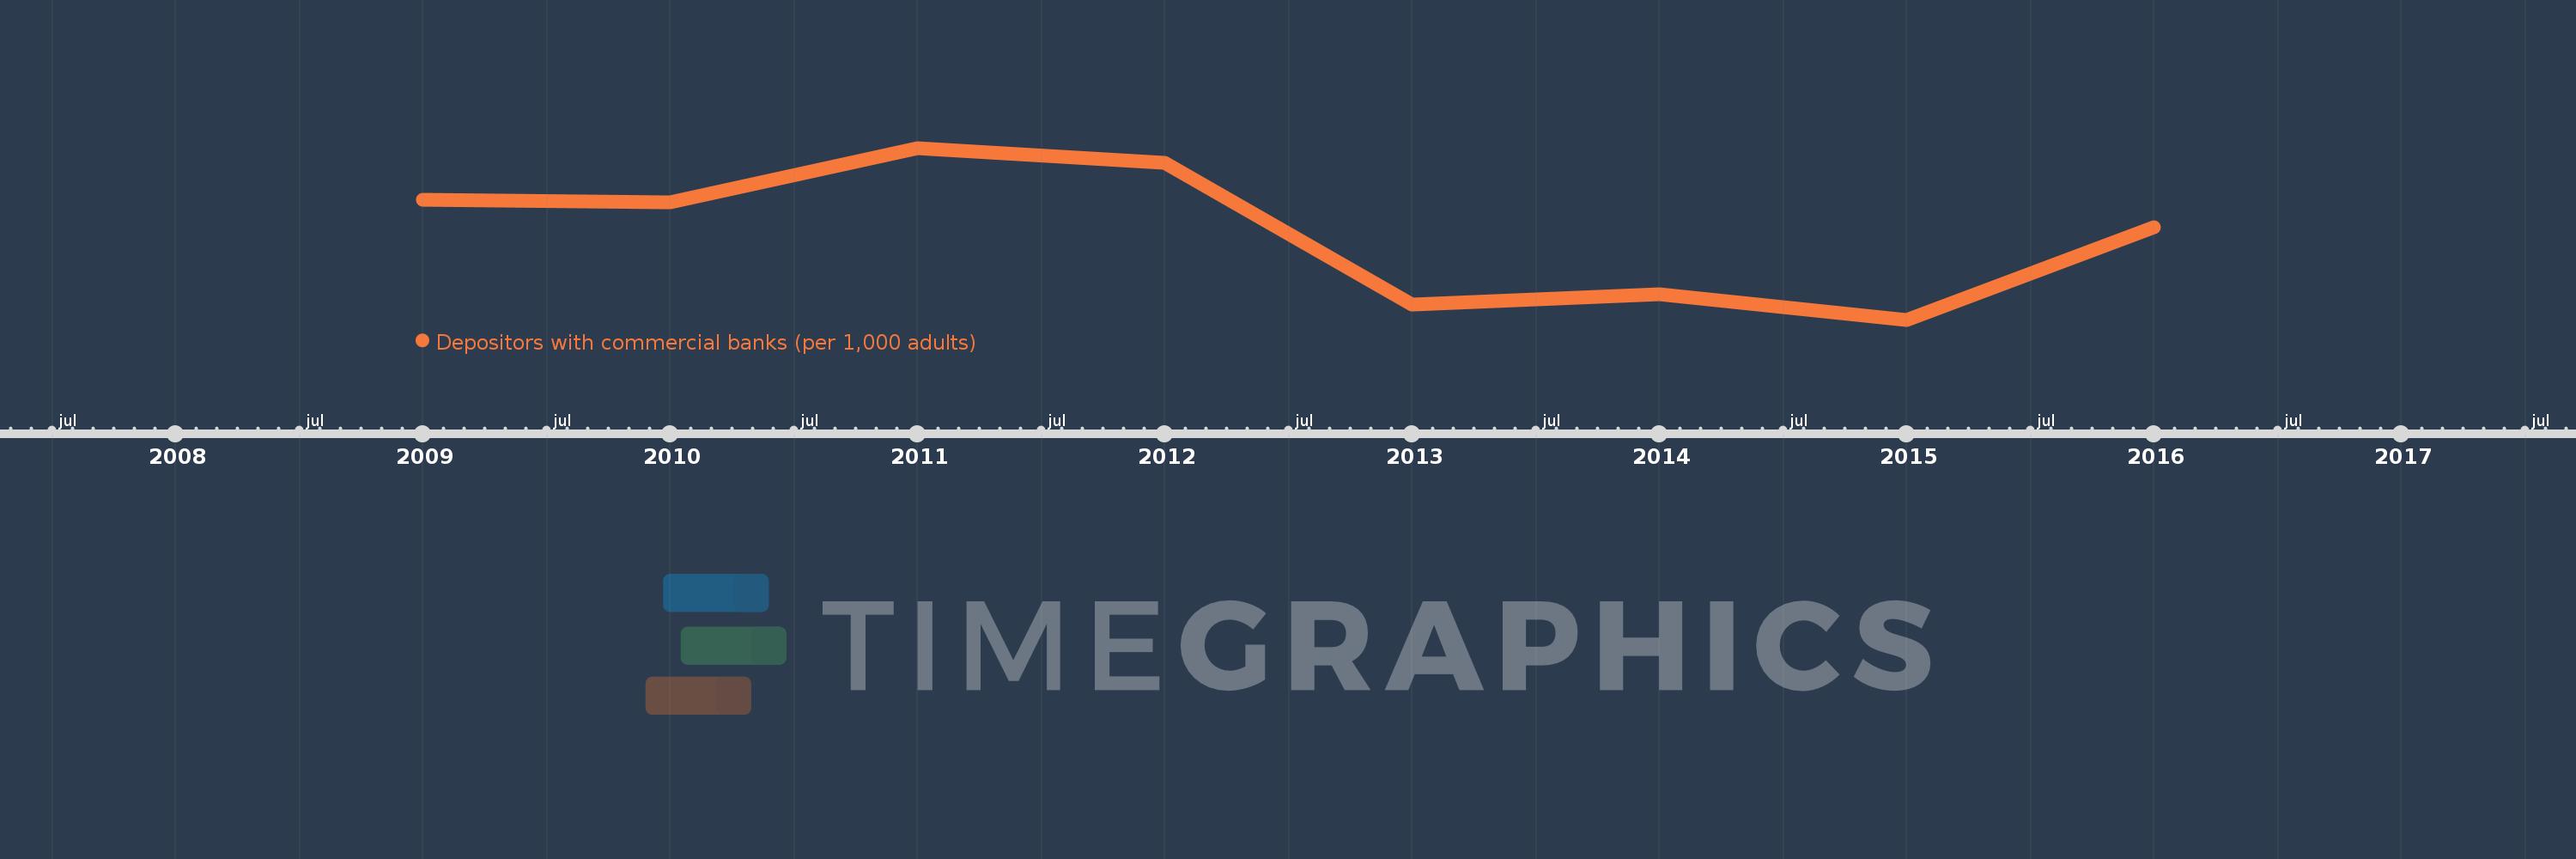
Depositors with commercial banks (per 1,000 adults)
2016,2015,2014,2013,2012,2011,2010,2009
This statistics in other country:
Timeline:
This timeline shows a graph from 2009 to 2016 of Israel. No data until 2008. Number of actual observations by date: 8.
Source name:
World Development Indicators
Source organization:
International Monetary Fund, Financial Access Survey.
Categories, topics:
Financial Sector
Last updated:
apr 23, 2017
Indicators value changes by year
Minimum:
931.468
jan 1, 2015
Maximum:
1.067K
jan 1, 2011
At the date of observation
Value
Absolute change
Change from previous value
jan 1, 2009
1.026K
+1.026K
0.0%
jan 1, 2010
1.024K
-1.931
-0.19%
jan 1, 2011
1.067K
+42.499
4.15%
jan 1, 2012
1.055K
-11.938
-1.12%
jan 1, 2013
943.725
-110.899
-10.52%
jan 1, 2014
951.677
+7.952
0.84%
jan 1, 2015
931.468
-20.208
-2.12%
jan 1, 2016
1.004K
+72.527
7.79%
Ranking of countries by current statistics by years


Comments: