29
/
en
AIzaSyAYiBZKx7MnpbEhh9jyipgxe19OcubqV5w
April 1, 2024
235593
Senegal
SEN
true
2
1
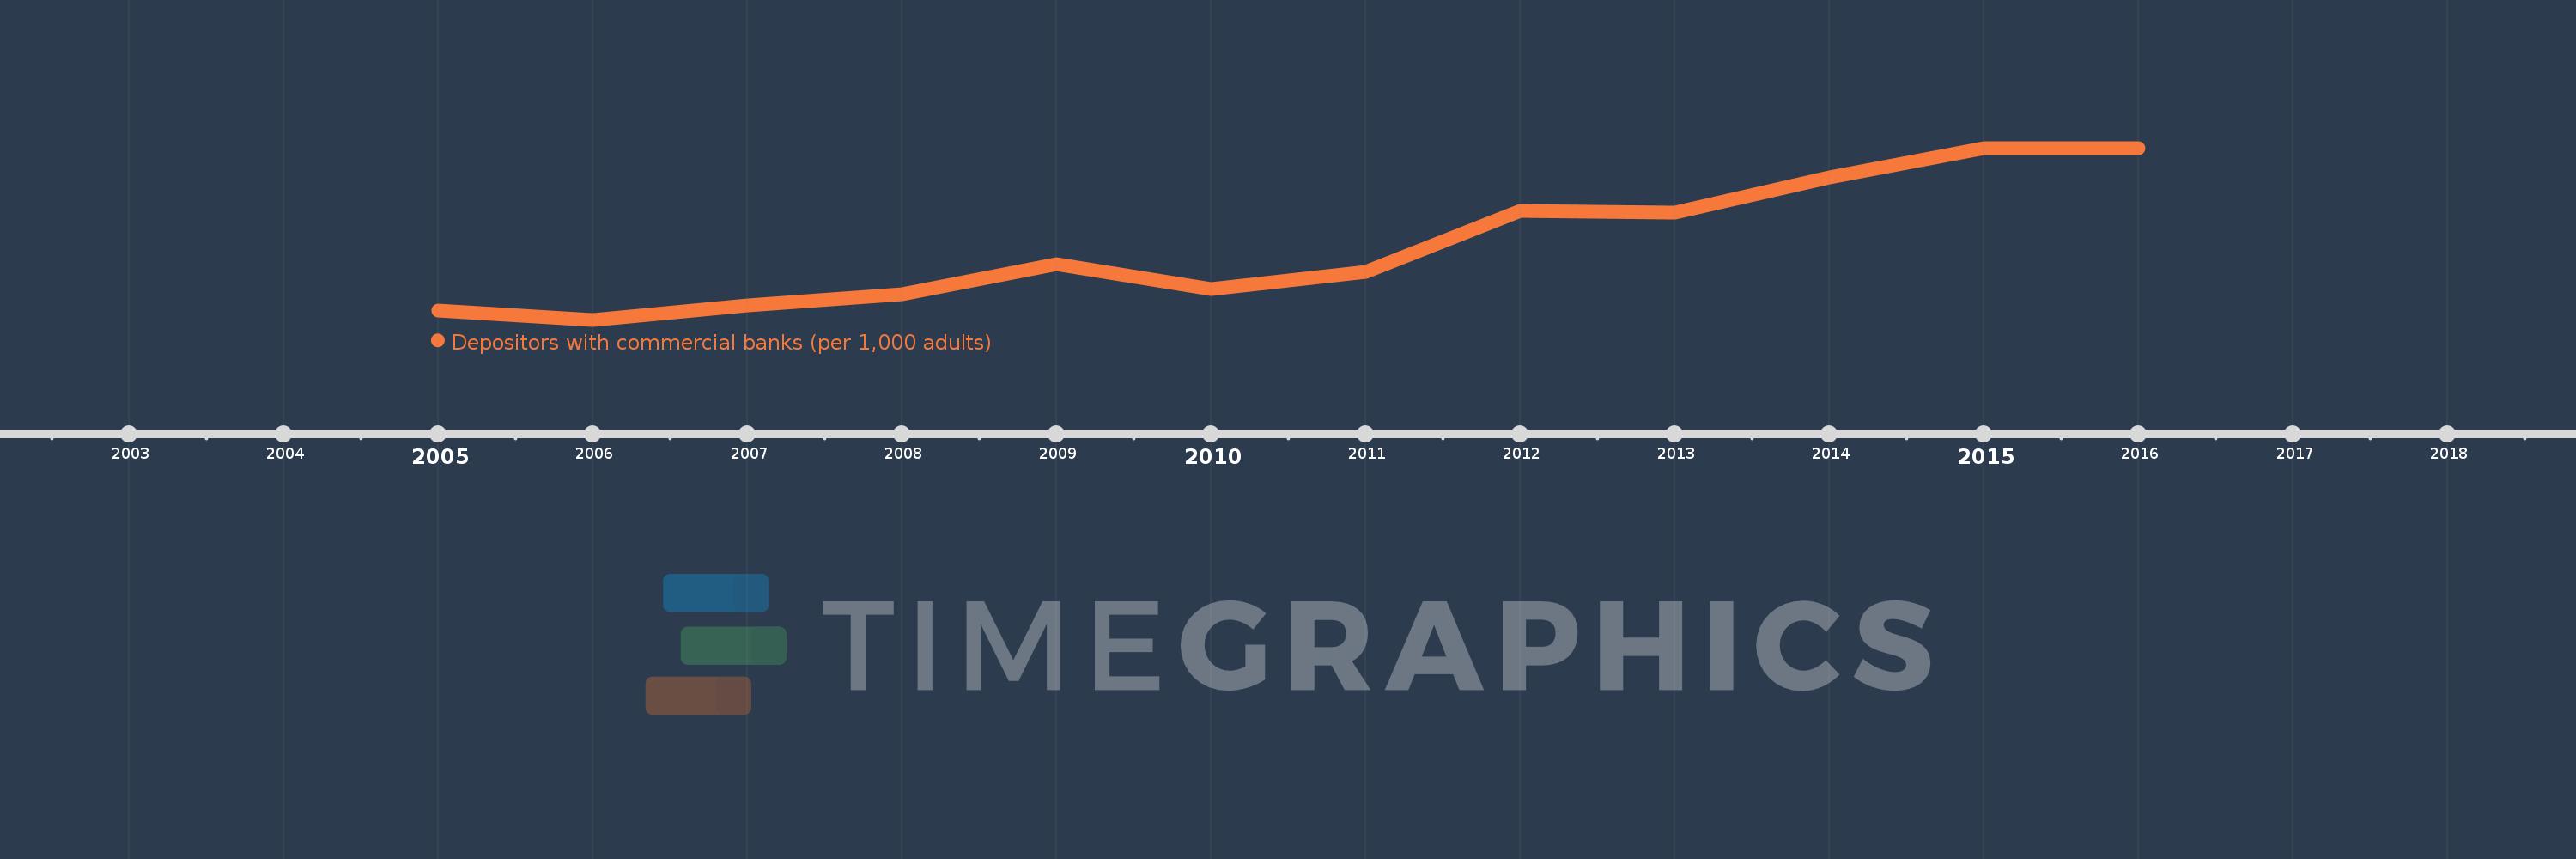
Depositors with commercial banks (per 1,000 adults)
2016,2015,2014,2013,2012,2011,2010,2009,2008,2007,2006,2005
This statistics in other country:
Timeline:
This timeline shows a graph from 2005 to 2016 of Senegal. No data until 2004. Number of actual observations by date: 12.
Source name:
World Development Indicators
Source organization:
International Monetary Fund, Financial Access Survey.
Categories, topics:
Financial Sector
Last updated:
apr 23, 2017
Indicators value changes by year
Minimum:
78.899
jan 1, 2006
Maximum:
163.51
jan 1, 2016
At the date of observation
Value
Absolute change
Change from previous value
jan 1, 2005
83.488
+83.488
0.0%
jan 1, 2006
78.899
-4.589
-5.5%
jan 1, 2007
86.125
+7.226
9.16%
jan 1, 2008
91.32
+5.195
6.03%
jan 1, 2009
106.341
+15.021
16.45%
jan 1, 2010
93.807
-12.534
-11.79%
jan 1, 2011
102.335
+8.528
9.09%
jan 1, 2012
132.429
+30.094
29.41%
jan 1, 2013
131.532
-0.896
-0.68%
jan 1, 2014
149.084
+17.551
13.34%
jan 1, 2015
163.442
+14.358
9.63%
jan 1, 2016
163.51
+0.068
0.04%
Ranking of countries by current statistics by years


Comments: