29
/
en
AIzaSyAYiBZKx7MnpbEhh9jyipgxe19OcubqV5w
April 1, 2024
135379
Gabon
GAB
true
2
1
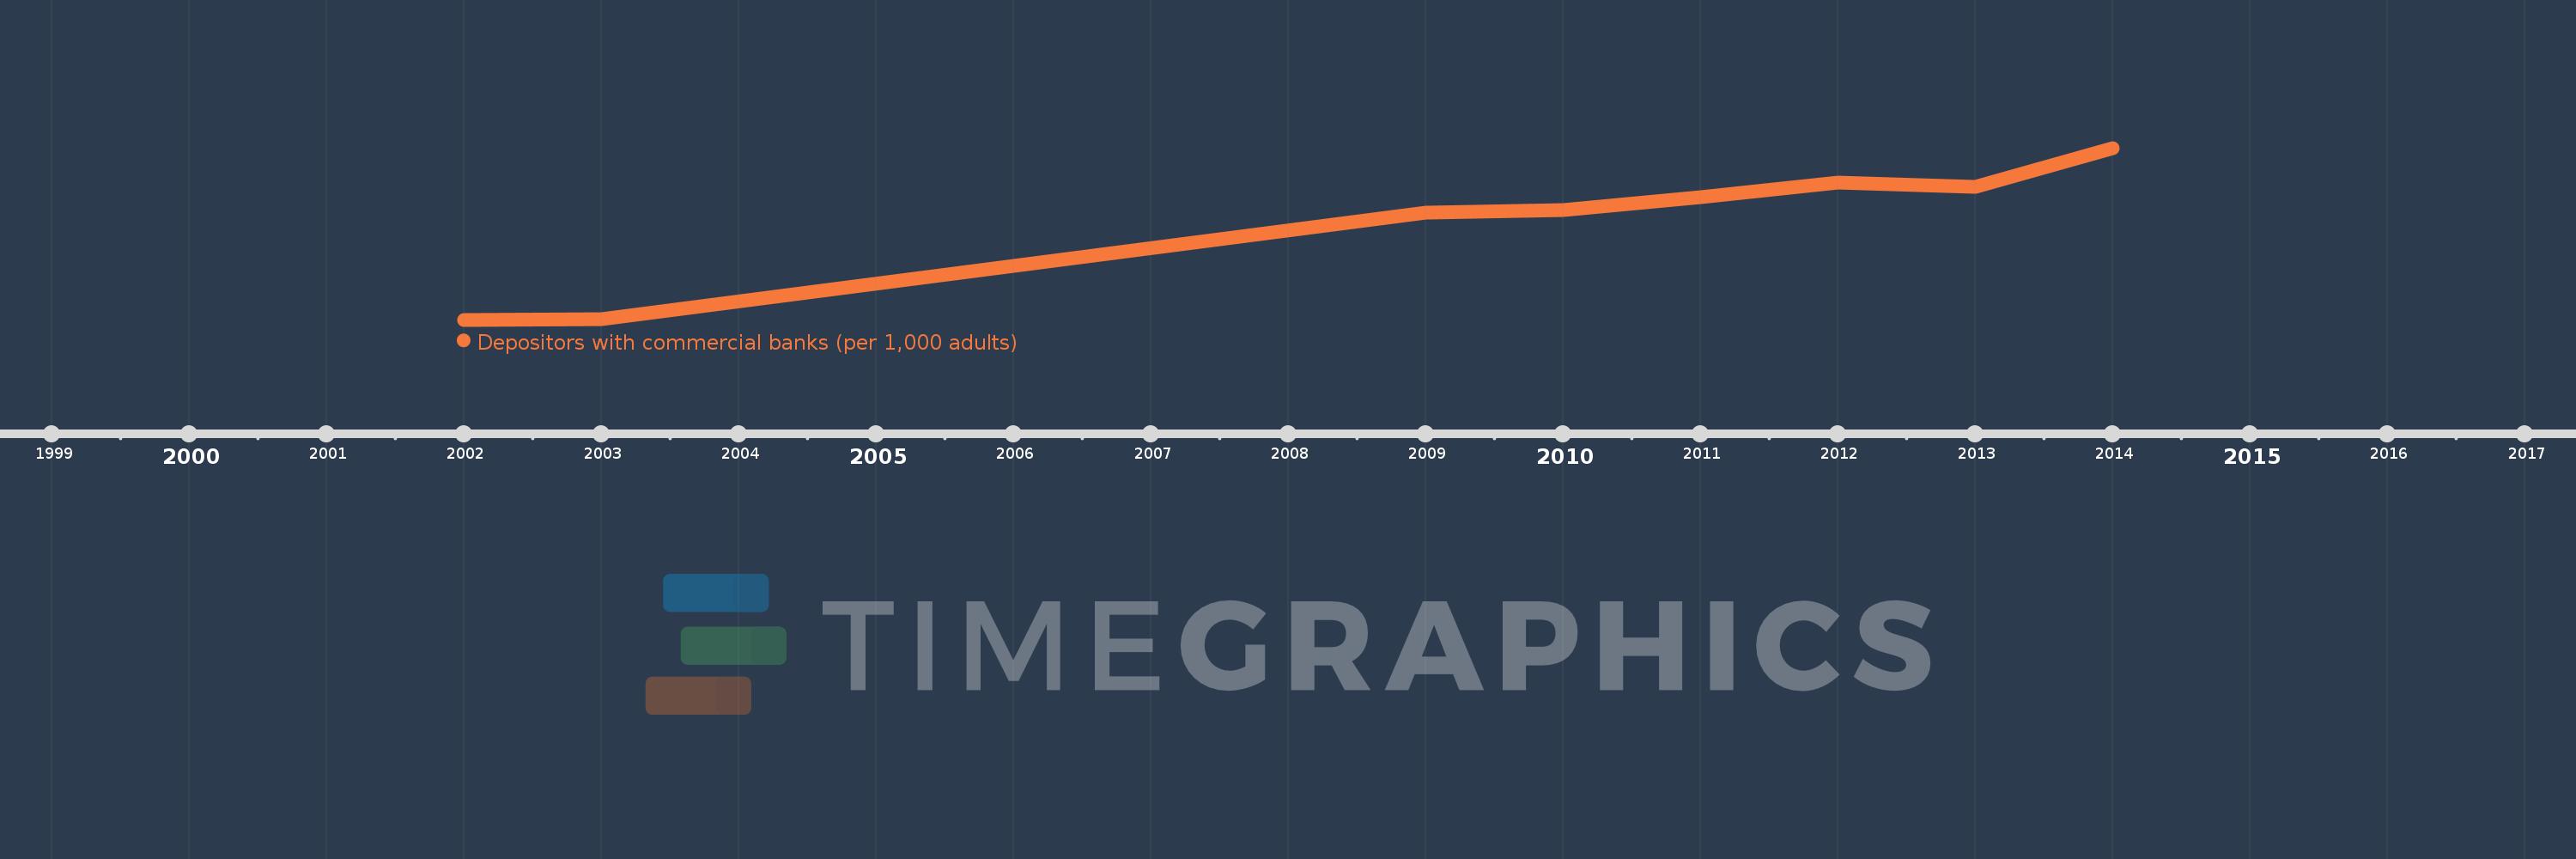
Depositors with commercial banks (per 1,000 adults)
2014,2013,2012,2011,2010,2009,2003,2002
This statistics in other country:
Timeline:
This timeline shows a graph from 2002 to 2014 of Gabon. No data until 2001. Number of actual observations by date: 8.
Source name:
World Development Indicators
Source organization:
International Monetary Fund, Financial Access Survey.
Categories, topics:
Financial Sector
Last updated:
apr 23, 2017
Indicators value changes by year
Maximum:
228.885
jan 1, 2014
At the date of observation
Value
Absolute change
Change from previous value
jan 1, 2002
9.959
+9.959
0.0%
jan 1, 2003
10.461
+0.502
5.04%
jan 1, 2009
146.873
+136.411
1.3K%
jan 1, 2010
149.997
+3.124
2.13%
jan 1, 2011
166.41
+16.413
10.94%
jan 1, 2012
184.638
+18.228
10.95%
jan 1, 2013
179.389
-5.248
-2.84%
jan 1, 2014
228.885
+49.496
27.59%
Ranking of countries by current statistics by years


Comments: