29
/
en
AIzaSyAYiBZKx7MnpbEhh9jyipgxe19OcubqV5w
April 1, 2024
171557
Kuwait
KWT
true
2
1
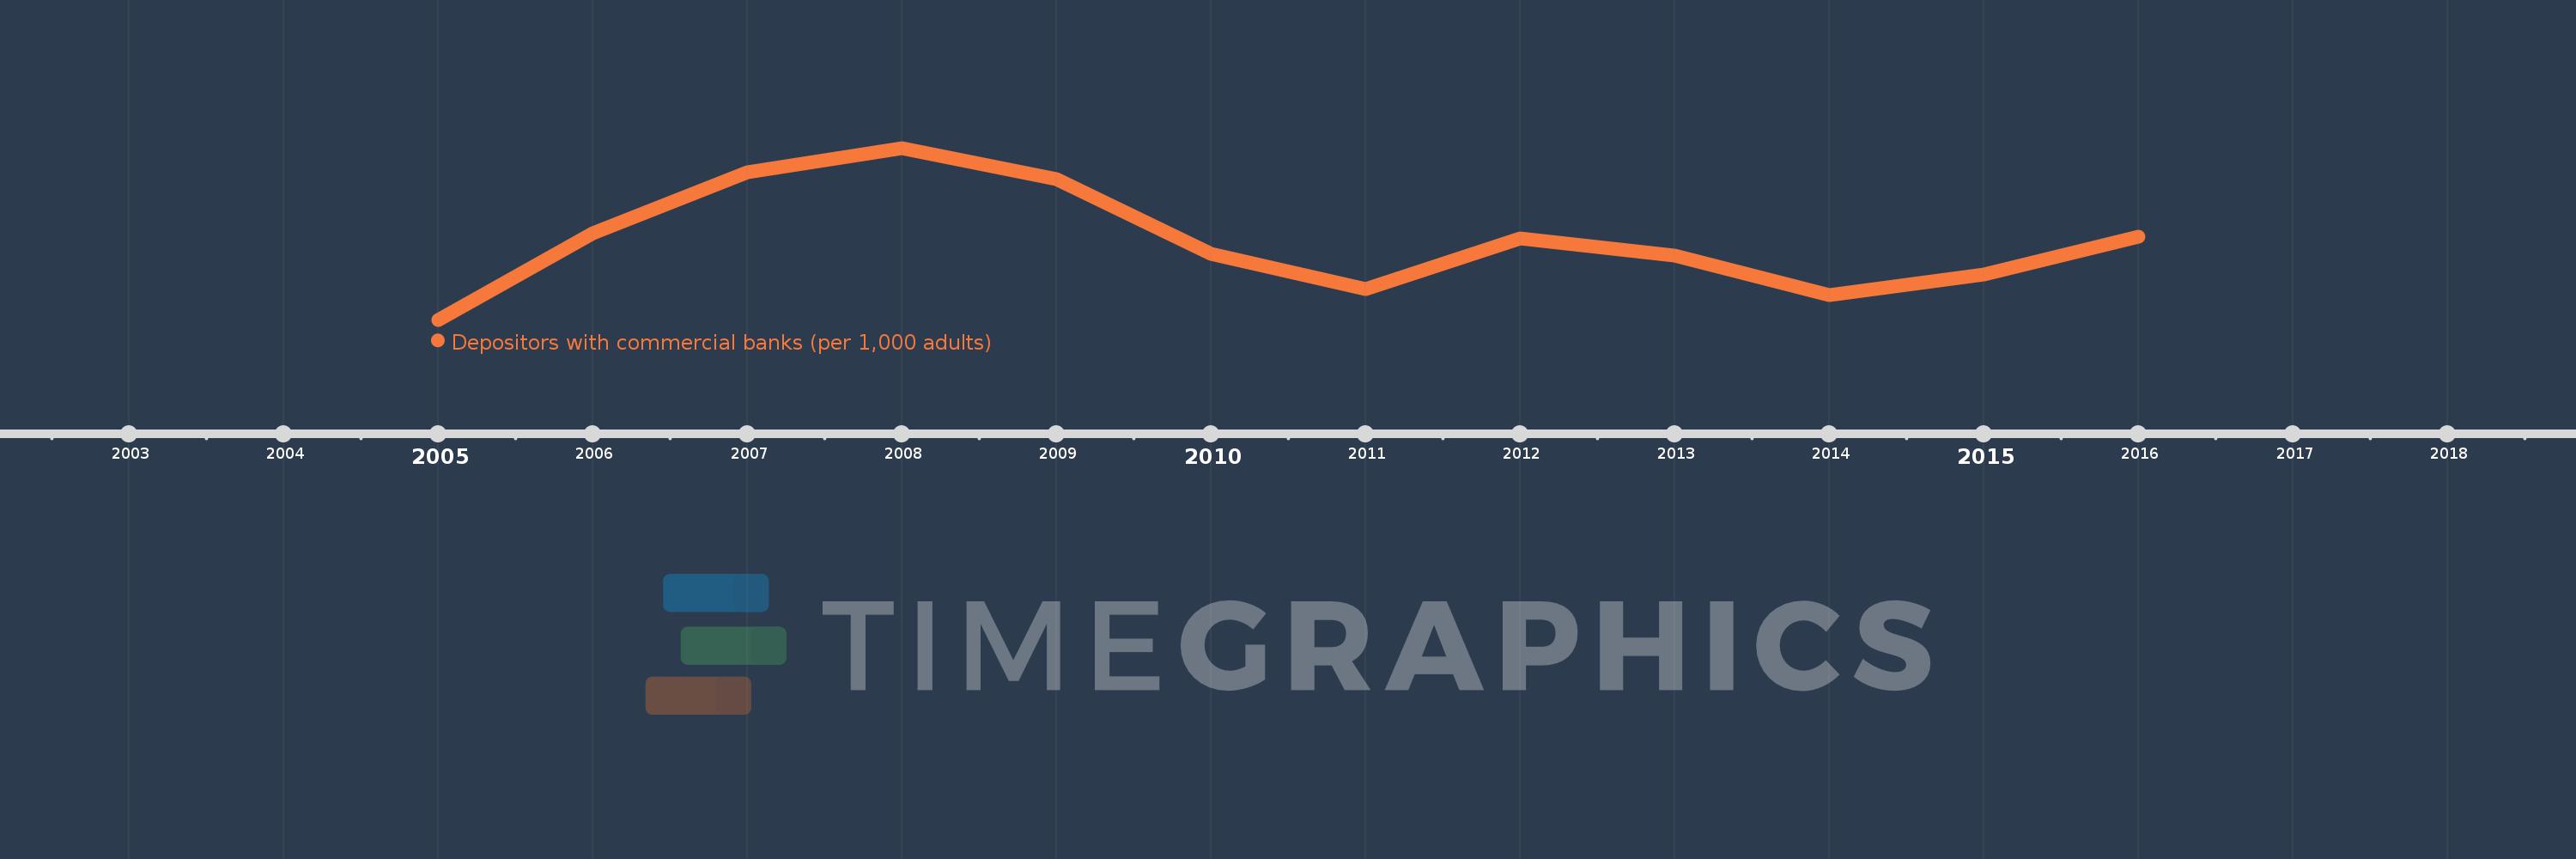
Depositors with commercial banks (per 1,000 adults)
2016,2015,2014,2013,2012,2011,2010,2009,2008,2007,2006,2005
This statistics in other country:
Timeline:
This timeline shows a graph from 2005 to 2016 of Kuwait. No data until 2004. Number of actual observations by date: 12.
Source name:
World Development Indicators
Source organization:
International Monetary Fund, Financial Access Survey.
Categories, topics:
Financial Sector
Last updated:
apr 23, 2017
Indicators value changes by year
Minimum:
1.099K
jan 1, 2005
At the date of observation
Value
Absolute change
Change from previous value
jan 1, 2005
1.099K
+1.099K
0.0%
jan 1, 2006
1.215K
+115.597
10.52%
jan 1, 2007
1.297K
+82.261
6.77%
jan 1, 2008
1.33K
+32.846
2.53%
jan 1, 2009
1.288K
-42.142
-3.17%
jan 1, 2010
1.187K
-100.634
-7.82%
jan 1, 2011
1.14K
-46.946
-3.95%
jan 1, 2012
1.208K
+68.068
5.97%
jan 1, 2013
1.185K
-23.308
-1.93%
jan 1, 2014
1.132K
-53.168
-4.49%
jan 1, 2015
1.16K
+28.275
2.5%
jan 1, 2016
1.21K
+50.156
4.32%
Ranking of countries by current statistics by years


Comments: