29
/
en
AIzaSyAYiBZKx7MnpbEhh9jyipgxe19OcubqV5w
April 1, 2024
260729
Tanzania
TZA
true
2
1
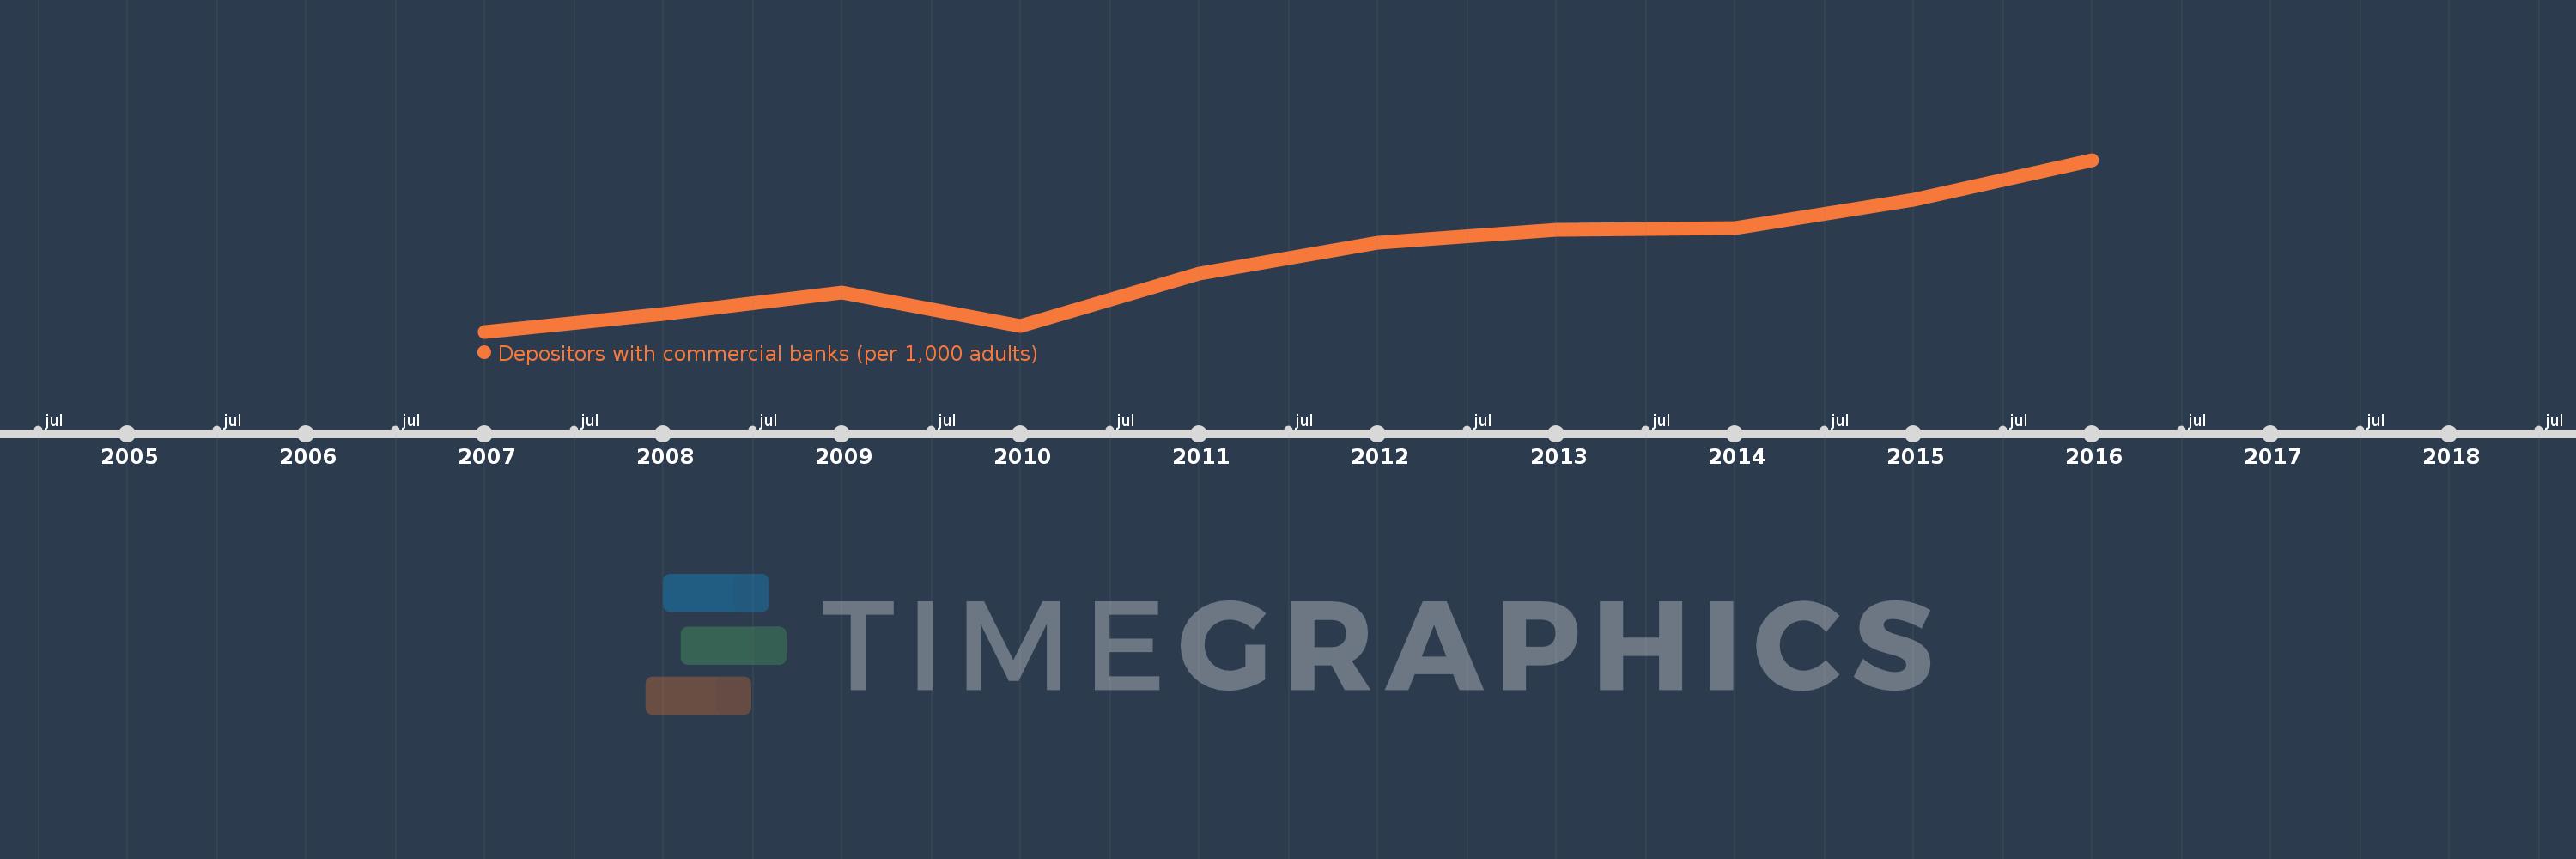
Depositors with commercial banks (per 1,000 adults)
2016,2015,2014,2013,2012,2011,2010,2009,2008,2007
This statistics in other country:
Timeline:
This timeline shows a graph from 2007 to 2016 of Tanzania. No data until 2006. Number of actual observations by date: 10.
Source name:
World Development Indicators
Source organization:
International Monetary Fund, Financial Access Survey.
Categories, topics:
Financial Sector
Last updated:
apr 23, 2017
Indicators value changes by year
Minimum:
151.765
jan 1, 2007
Maximum:
265.011
jan 1, 2016
At the date of observation
Value
Absolute change
Change from previous value
jan 1, 2007
151.765
+151.765
0.0%
jan 1, 2008
163.618
+11.853
7.81%
jan 1, 2009
177.388
+13.77
8.42%
jan 1, 2010
155.628
-21.759
-12.27%
jan 1, 2011
190.227
+34.598
22.23%
jan 1, 2012
210.398
+20.172
10.6%
jan 1, 2013
218.637
+8.239
3.92%
jan 1, 2014
219.723
+1.086
0.5%
jan 1, 2015
238.415
+18.692
8.51%
jan 1, 2016
265.011
+26.595
11.15%
Ranking of countries by current statistics by years


Comments: