29
/
en
AIzaSyAYiBZKx7MnpbEhh9jyipgxe19OcubqV5w
April 1, 2024
108408
Comoros
COM
true
2
1
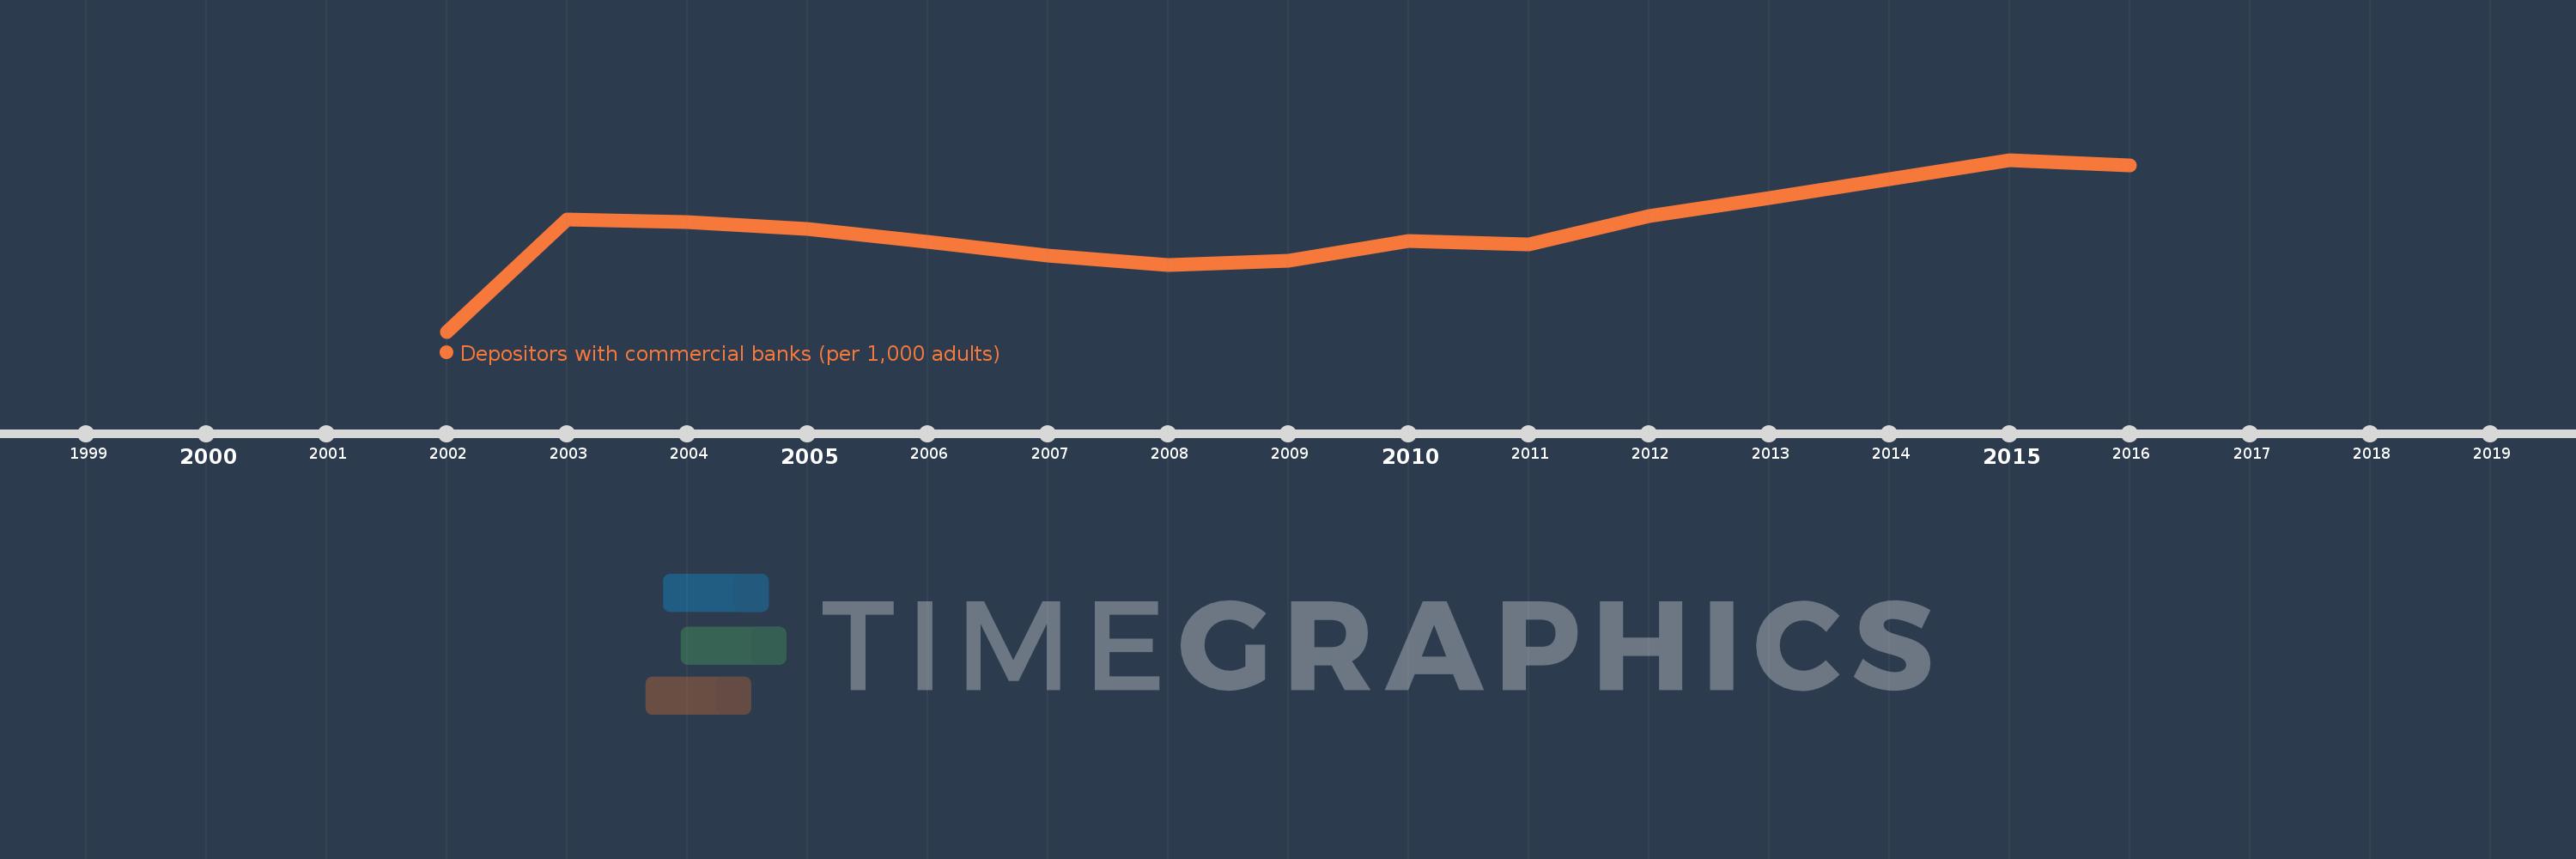
Depositors with commercial banks (per 1,000 adults)
2016,2015,2014,2013,2012,2011,2010,2009,2008,2007,2006,2005,2004,2003,2002
This statistics in other country:
Timeline:
This timeline shows a graph from 2002 to 2016 of Comoros. No data until 2001. Number of actual observations by date: 15.
Source name:
World Development Indicators
Source organization:
International Monetary Fund, Financial Access Survey.
Categories, topics:
Financial Sector
Last updated:
apr 23, 2017
Indicators value changes by year
Maximum:
118.169
jan 1, 2015
At the date of observation
Value
Absolute change
Change from previous value
jan 1, 2003
76.971
+76.971
%
jan 1, 2004
75.288
-1.683
-2.19%
jan 1, 2005
70.782
-4.505
-5.98%
jan 1, 2006
61.495
-9.287
-13.12%
jan 1, 2007
52.269
-9.226
-15.0%
jan 1, 2008
45.502
-6.768
-12.95%
jan 1, 2009
48.788
+3.286
7.22%
jan 1, 2010
62.045
+13.257
27.17%
jan 1, 2011
60.106
-1.939
-3.13%
jan 1, 2012
79.402
+19.297
32.1%
jan 1, 2013
92.021
+12.618
15.89%
jan 1, 2014
104.912
+12.892
14.01%
jan 1, 2015
118.169
+13.257
12.64%
jan 1, 2016
114.589
-3.58
-3.03%
Ranking of countries by current statistics by years


Comments: