29
/
en
AIzaSyAYiBZKx7MnpbEhh9jyipgxe19OcubqV5w
April 1, 2024
246645
South Sudan
SSD
true
2
1
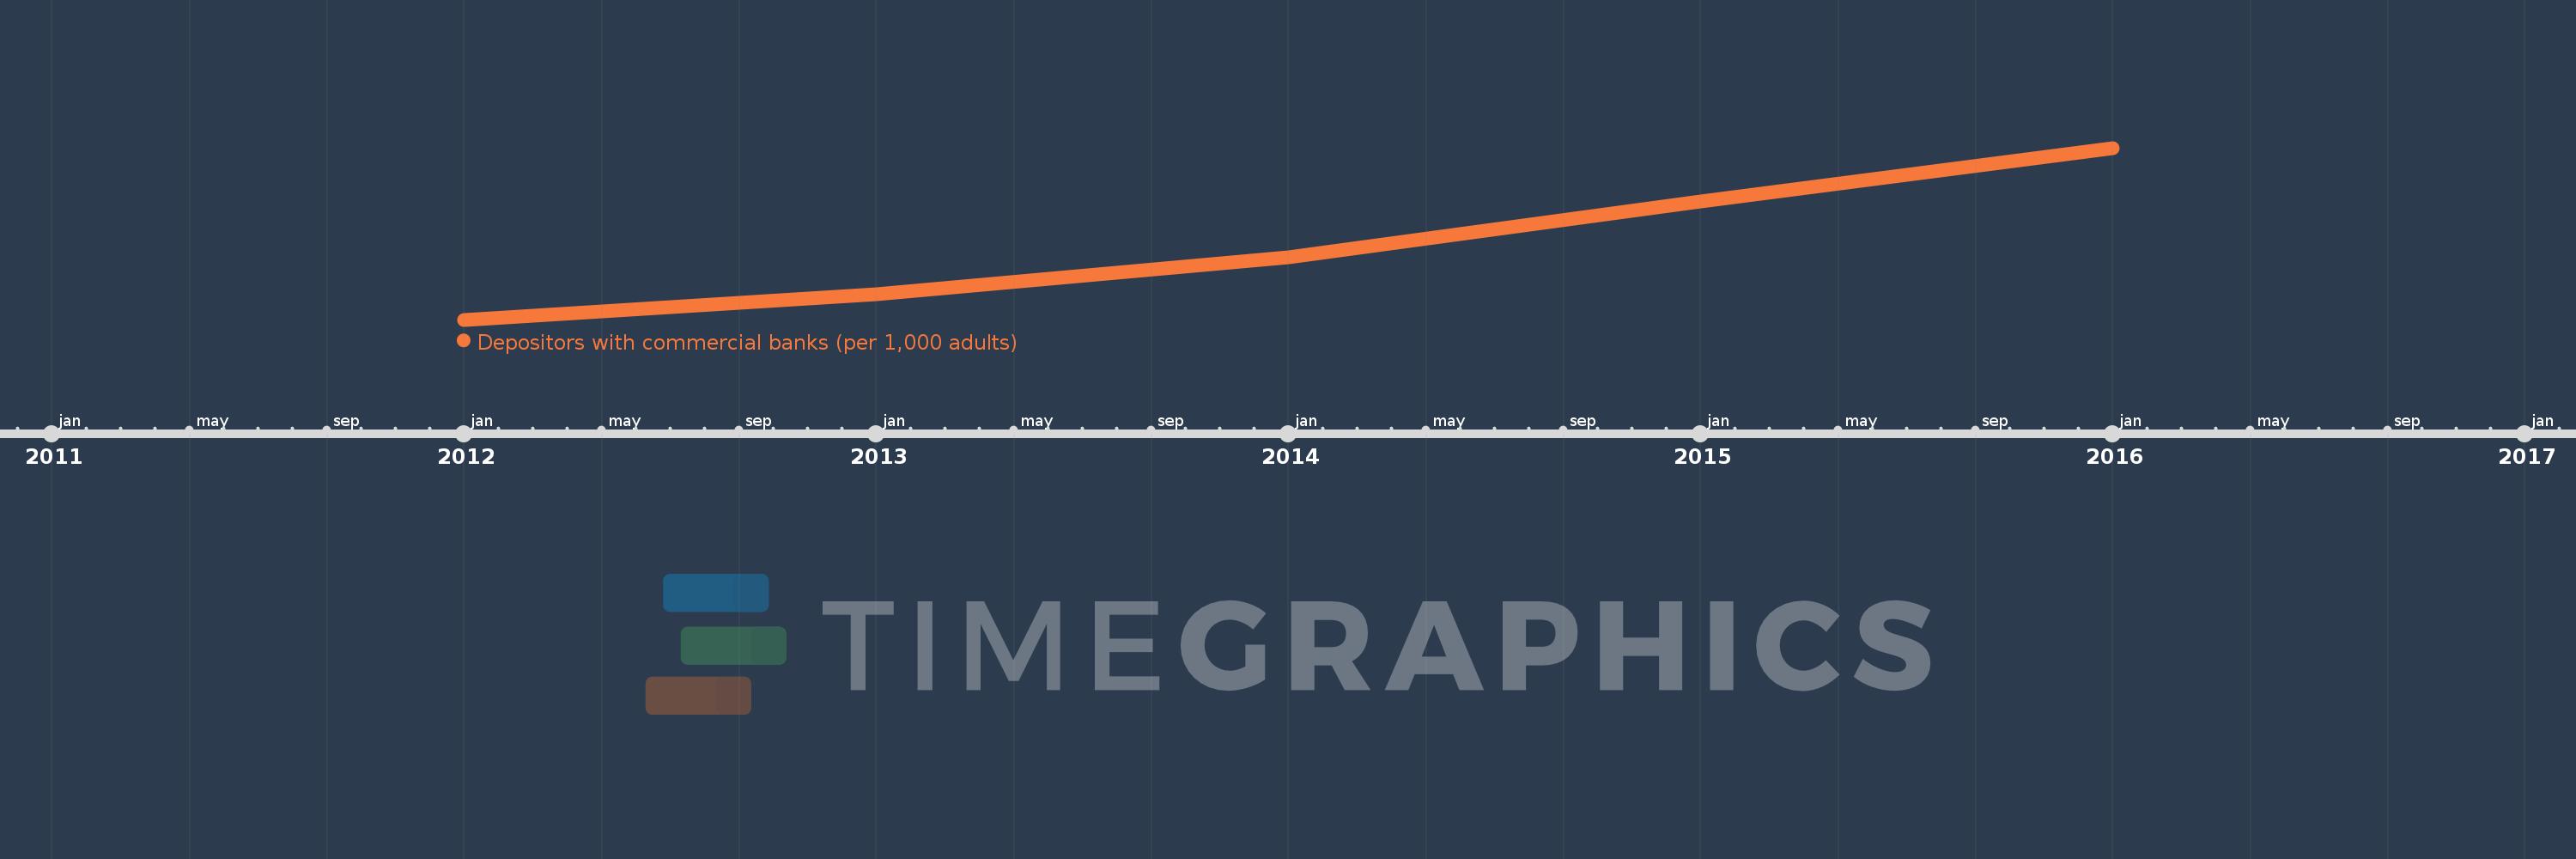
Depositors with commercial banks (per 1,000 adults)
2016,2015,2014,2013,2012
This statistics in other country:
Timeline:
This timeline shows a graph from 2012 to 2016 of South Sudan. No data until 2011. Number of actual observations by date: 5.
Source name:
World Development Indicators
Source organization:
International Monetary Fund, Financial Access Survey.
Categories, topics:
Financial Sector
Last updated:
apr 23, 2017
Indicators value changes by year
Minimum:
20.394
jan 1, 2012
Maximum:
63.965
jan 1, 2016
At the date of observation
Value
Absolute change
Change from previous value
jan 1, 2012
20.394
+20.394
0.0%
jan 1, 2013
26.905
+6.511
31.92%
jan 1, 2014
36.337
+9.432
35.06%
jan 1, 2015
50.392
+14.055
38.68%
jan 1, 2016
63.965
+13.574
26.94%
Ranking of countries by current statistics by years


Comments: