29
/
en
AIzaSyAYiBZKx7MnpbEhh9jyipgxe19OcubqV5w
April 1, 2024
92466
Brunei Darussalam
BRN
true
2
1
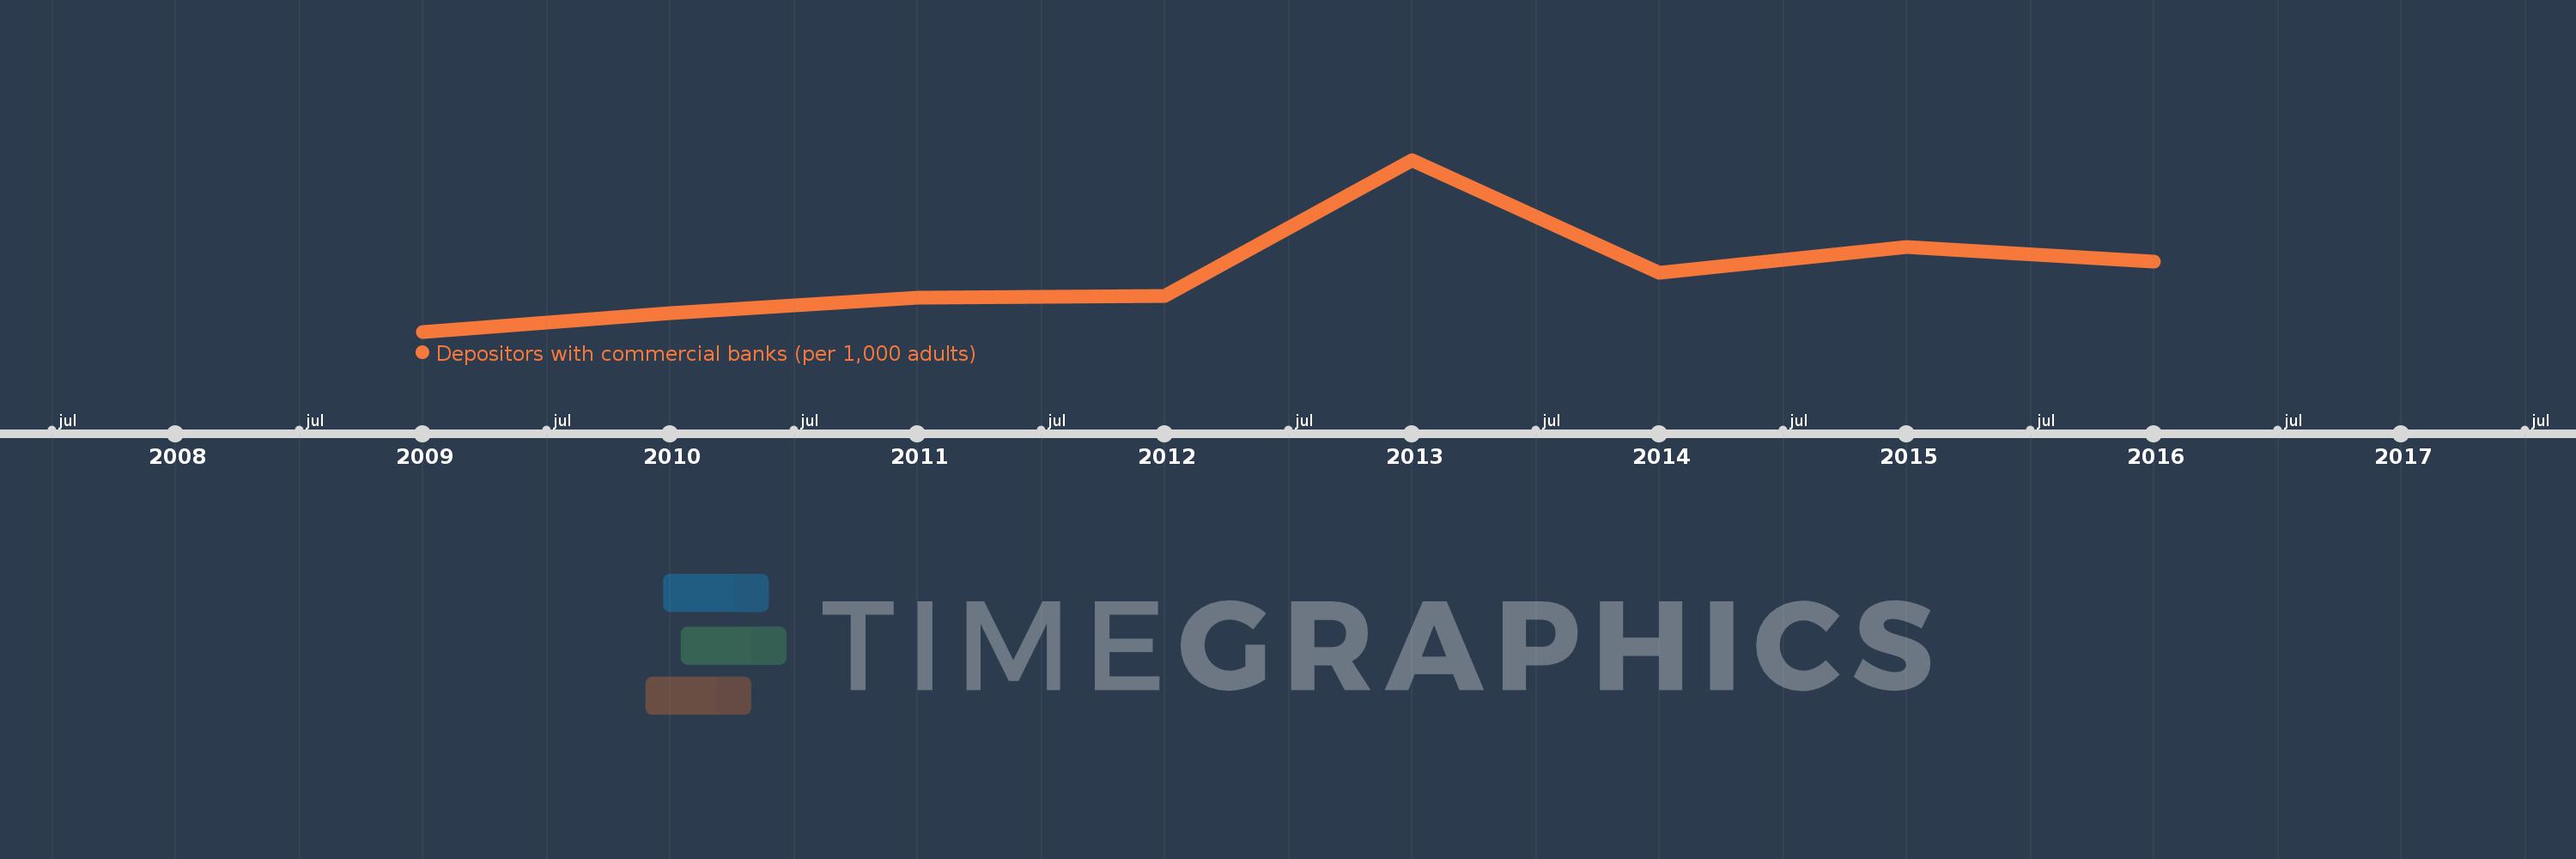
Depositors with commercial banks (per 1,000 adults)
2016,2015,2014,2013,2012,2011,2010,2009
This statistics in other country:
Timeline:
This timeline shows a graph from 2009 to 2016 of Brunei Darussalam. No data until 2008. Number of actual observations by date: 8.
Source name:
World Development Indicators
Source organization:
International Monetary Fund, Financial Access Survey.
Categories, topics:
Financial Sector
Last updated:
apr 23, 2017
Indicators value changes by year
Minimum:
1.322K
jan 1, 2009
At the date of observation
Value
Absolute change
Change from previous value
jan 1, 2009
1.322K
+1.322K
0.0%
jan 1, 2010
1.379K
+57.574
4.36%
jan 1, 2011
1.425K
+45.788
3.32%
jan 1, 2012
1.43K
+5.128
0.36%
jan 1, 2013
1.85K
+420.452
29.4%
jan 1, 2014
1.502K
-348.733
-18.85%
jan 1, 2015
1.582K
+80.312
5.35%
jan 1, 2016
1.537K
-45.057
-2.85%
Ranking of countries by current statistics by years


Comments: