29
/
en
AIzaSyAYiBZKx7MnpbEhh9jyipgxe19OcubqV5w
April 1, 2024
287041
Zimbabwe
ZWE
true
2
1
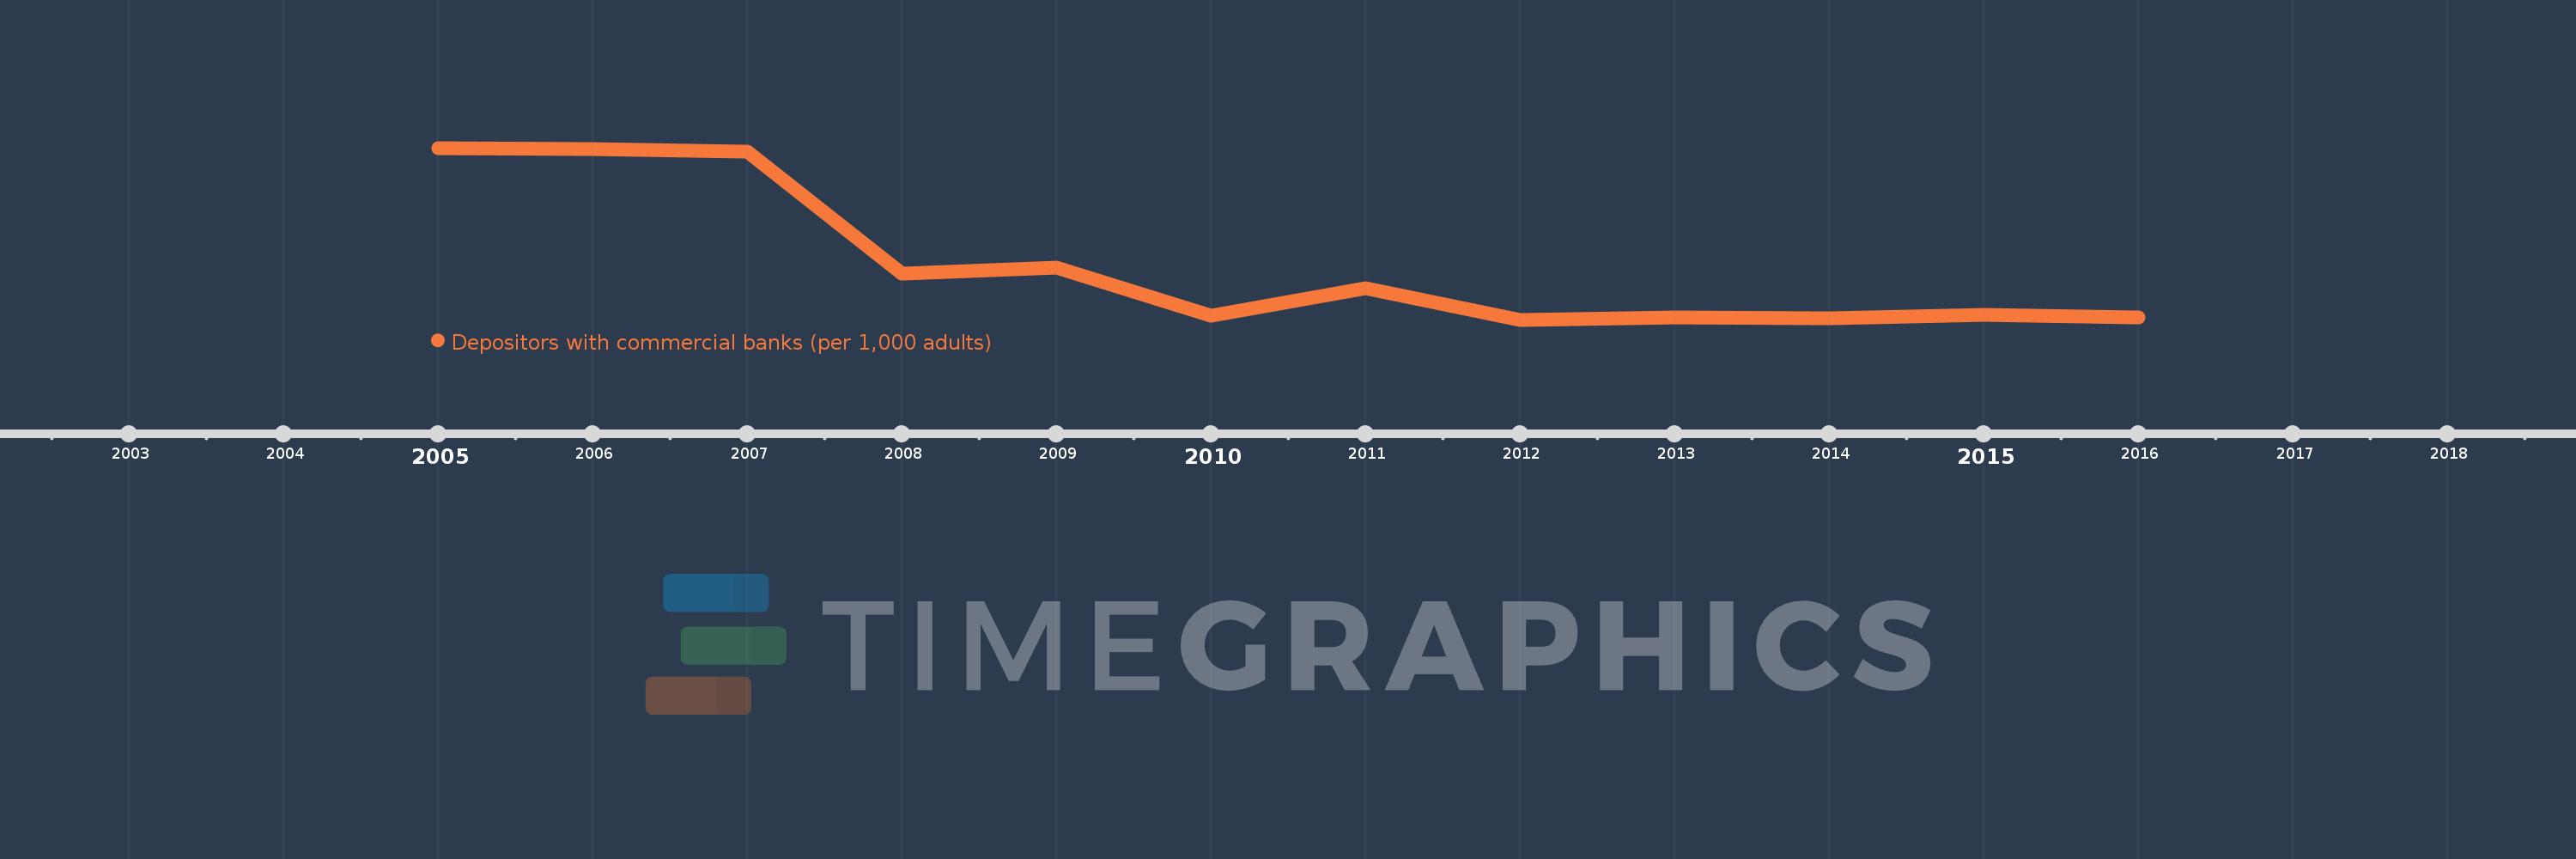
Depositors with commercial banks (per 1,000 adults)
2016,2015,2014,2013,2012,2011,2010,2009,2008,2007,2006,2005
This statistics in other country:
Timeline:
This timeline shows a graph from 2005 to 2016 of Zimbabwe. No data until 2004. Number of actual observations by date: 12.
Source name:
World Development Indicators
Source organization:
International Monetary Fund, Financial Access Survey.
Categories, topics:
Financial Sector
Last updated:
apr 23, 2017
Indicators value changes by year
Maximum:
489.446
jan 1, 2005
At the date of observation
Value
Absolute change
Change from previous value
jan 1, 2005
489.446
+489.446
0.0%
jan 1, 2006
486.728
-2.718
-0.56%
jan 1, 2007
480.111
-6.616
-1.36%
jan 1, 2008
186.095
-294.016
-61.24%
jan 1, 2009
200.868
+14.773
7.94%
jan 1, 2010
85.905
-114.963
-57.23%
jan 1, 2011
151.92
+66.015
76.85%
jan 1, 2012
75.45
-76.47
-50.34%
jan 1, 2013
80.601
+5.151
6.83%
jan 1, 2014
78.85
-1.751
-2.17%
jan 1, 2015
88.043
+9.193
11.66%
jan 1, 2016
81.014
-7.029
-7.98%
Ranking of countries by current statistics by years


Comments: