29
/
en
AIzaSyAYiBZKx7MnpbEhh9jyipgxe19OcubqV5w
April 1, 2024
140220
Ghana
GHA
true
2
1
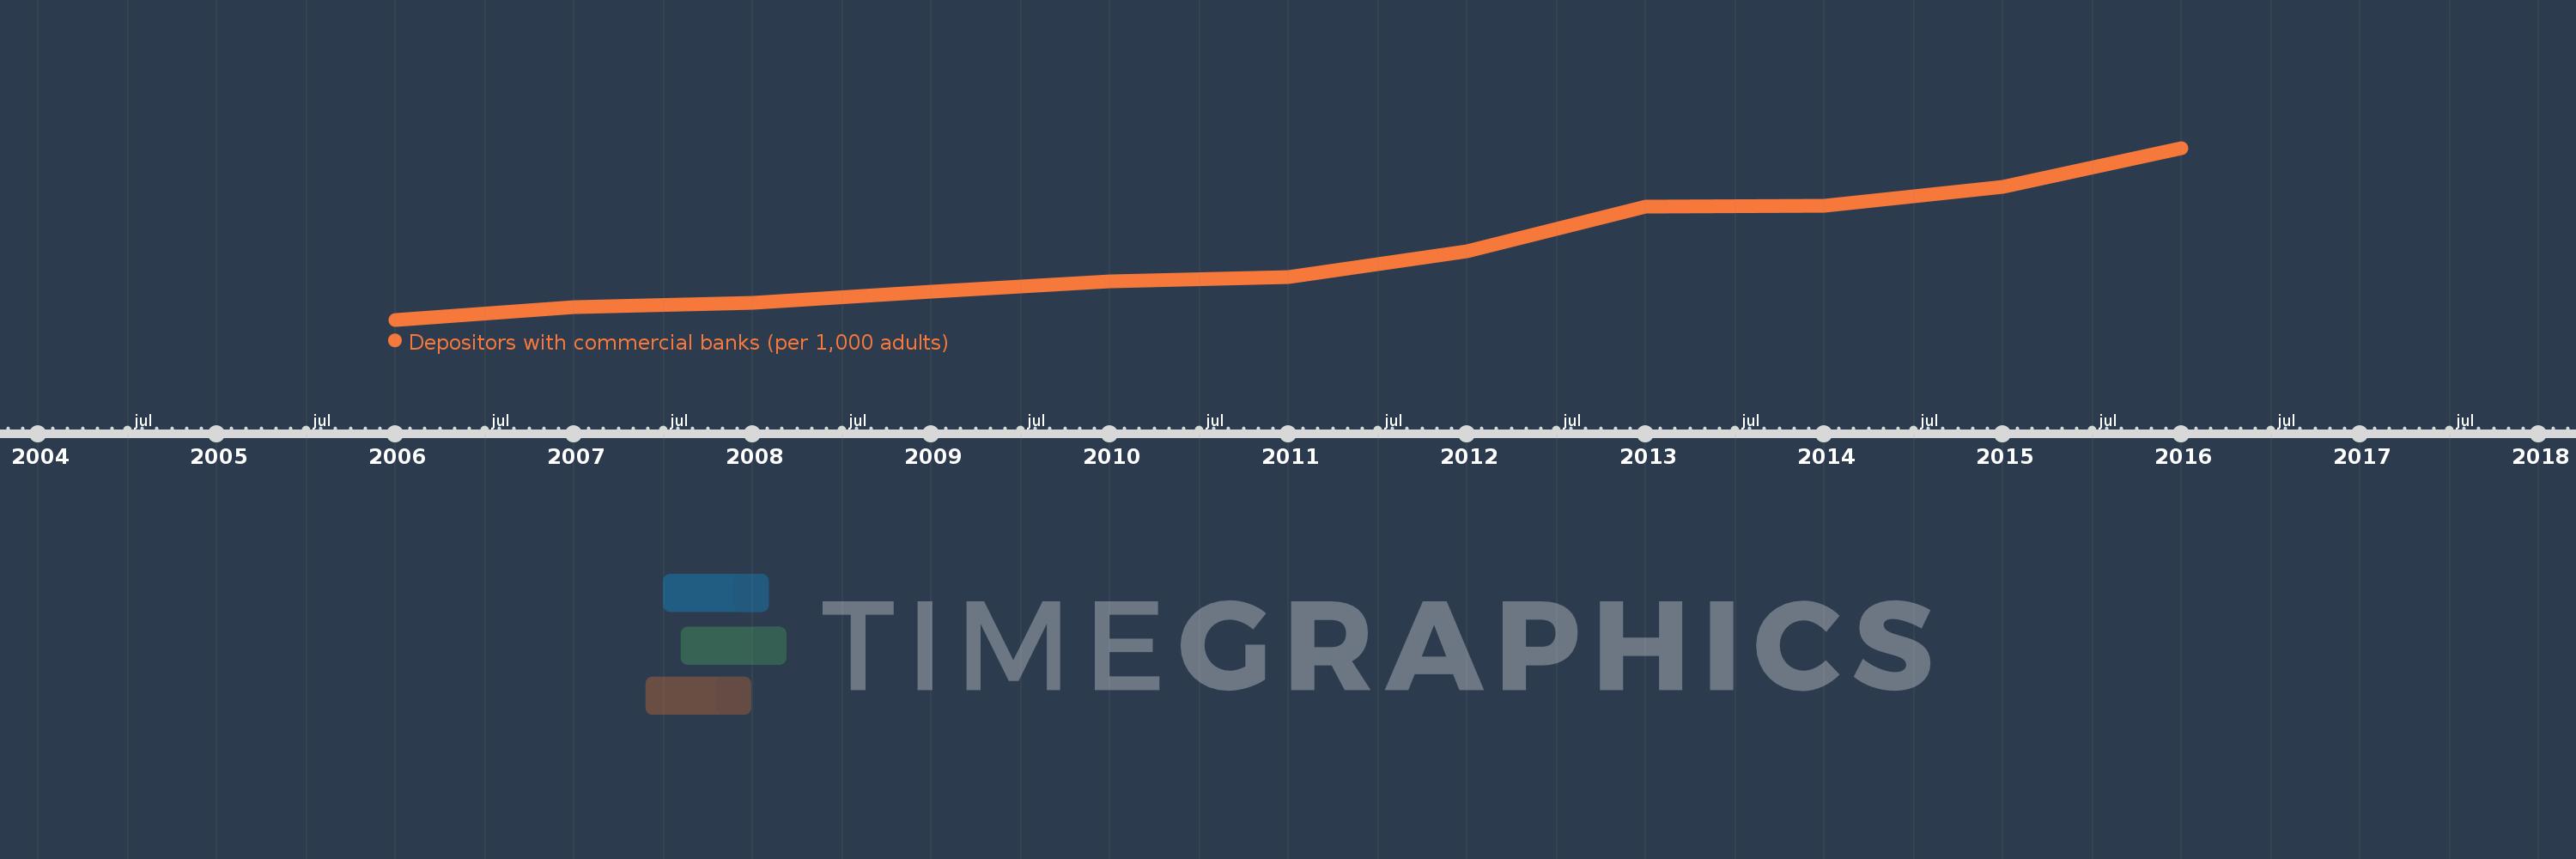
Depositors with commercial banks (per 1,000 adults)
2016,2015,2014,2013,2012,2011,2010,2009,2008,2007,2006
This statistics in other country:
Timeline:
This timeline shows a graph from 2006 to 2016 of Ghana. No data until 2005. Number of actual observations by date: 11.
Source name:
World Development Indicators
Source organization:
International Monetary Fund, Financial Access Survey.
Categories, topics:
Financial Sector
Last updated:
apr 23, 2017
Indicators value changes by year
Minimum:
178.147
jan 1, 2006
Maximum:
599.331
jan 1, 2016
At the date of observation
Value
Absolute change
Change from previous value
jan 1, 2006
178.147
+178.147
0.0%
jan 1, 2007
208.942
+30.796
17.29%
jan 1, 2008
220.221
+11.279
5.4%
jan 1, 2009
247.204
+26.983
12.25%
jan 1, 2010
271.578
+24.374
9.86%
jan 1, 2011
282.911
+11.333
4.17%
jan 1, 2012
346.382
+63.471
22.44%
jan 1, 2013
456.255
+109.872
31.72%
jan 1, 2014
458.125
+1.87
0.41%
jan 1, 2015
504.0
+45.875
10.01%
jan 1, 2016
599.331
+95.331
18.91%
Ranking of countries by current statistics by years


Comments: