29
/
en
AIzaSyAYiBZKx7MnpbEhh9jyipgxe19OcubqV5w
April 1, 2024
272091
Uganda
UGA
true
2
1
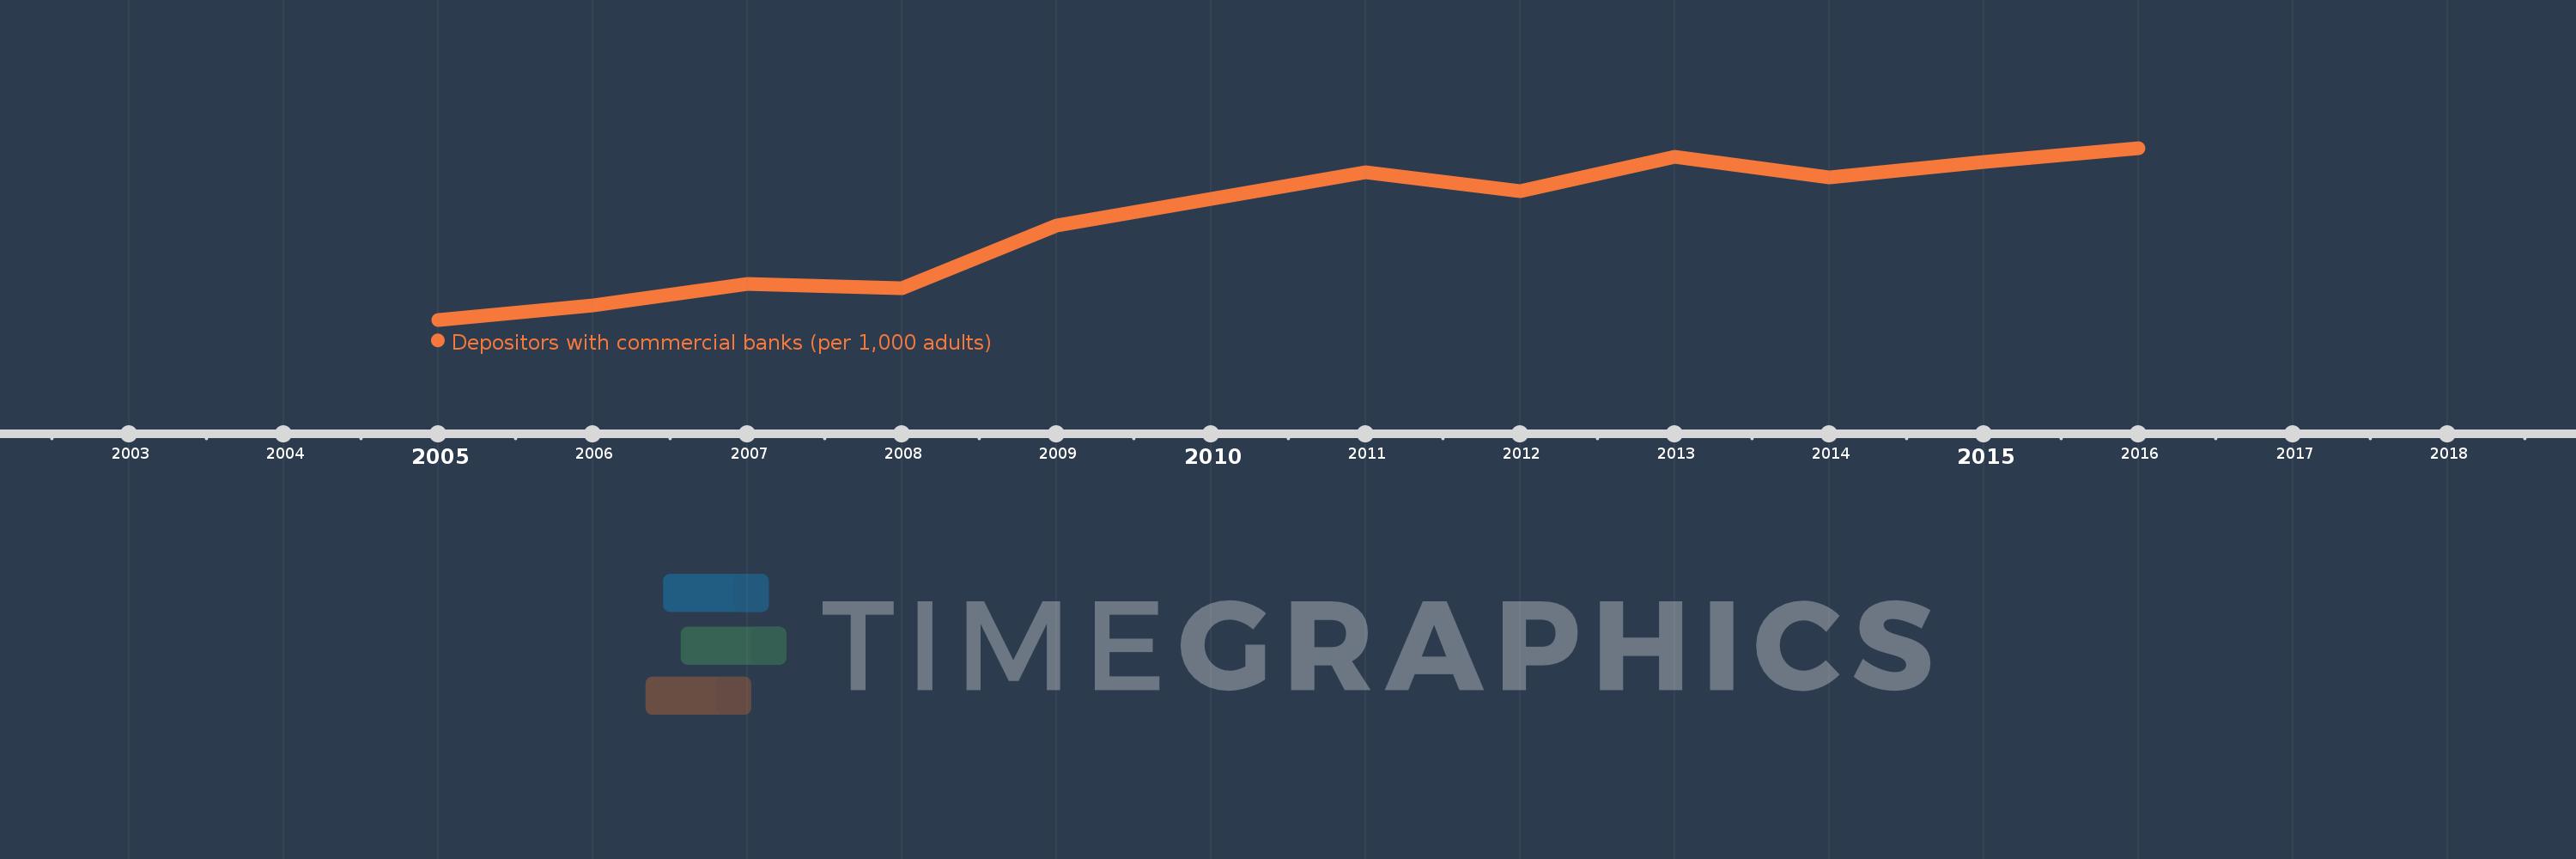
Depositors with commercial banks (per 1,000 adults)
2016,2015,2014,2013,2012,2011,2010,2009,2008,2007,2006,2005
This statistics in other country:
Timeline:
This timeline shows a graph from 2005 to 2016 of Uganda. No data until 2004. Number of actual observations by date: 12.
Source name:
World Development Indicators
Source organization:
International Monetary Fund, Financial Access Survey.
Categories, topics:
Financial Sector
Last updated:
apr 23, 2017
Indicators value changes by year
Maximum:
206.295
jan 1, 2016
At the date of observation
Value
Absolute change
Change from previous value
jan 1, 2005
89.36
+89.36
0.0%
jan 1, 2006
98.946
+9.587
10.73%
jan 1, 2007
113.797
+14.85
15.01%
jan 1, 2008
110.795
-3.001
-2.64%
jan 1, 2009
153.257
+42.462
38.32%
jan 1, 2010
171.358
+18.101
11.81%
jan 1, 2011
189.646
+18.289
10.67%
jan 1, 2012
177.06
-12.586
-6.64%
jan 1, 2013
200.212
+23.152
13.08%
jan 1, 2014
186.198
-14.014
-7.0%
jan 1, 2015
196.848
+10.649
5.72%
jan 1, 2016
206.295
+9.447
4.8%
Ranking of countries by current statistics by years


Comments: