29
/
en
AIzaSyAYiBZKx7MnpbEhh9jyipgxe19OcubqV5w
April 1, 2024
255053
Swaziland
SWZ
true
2
1
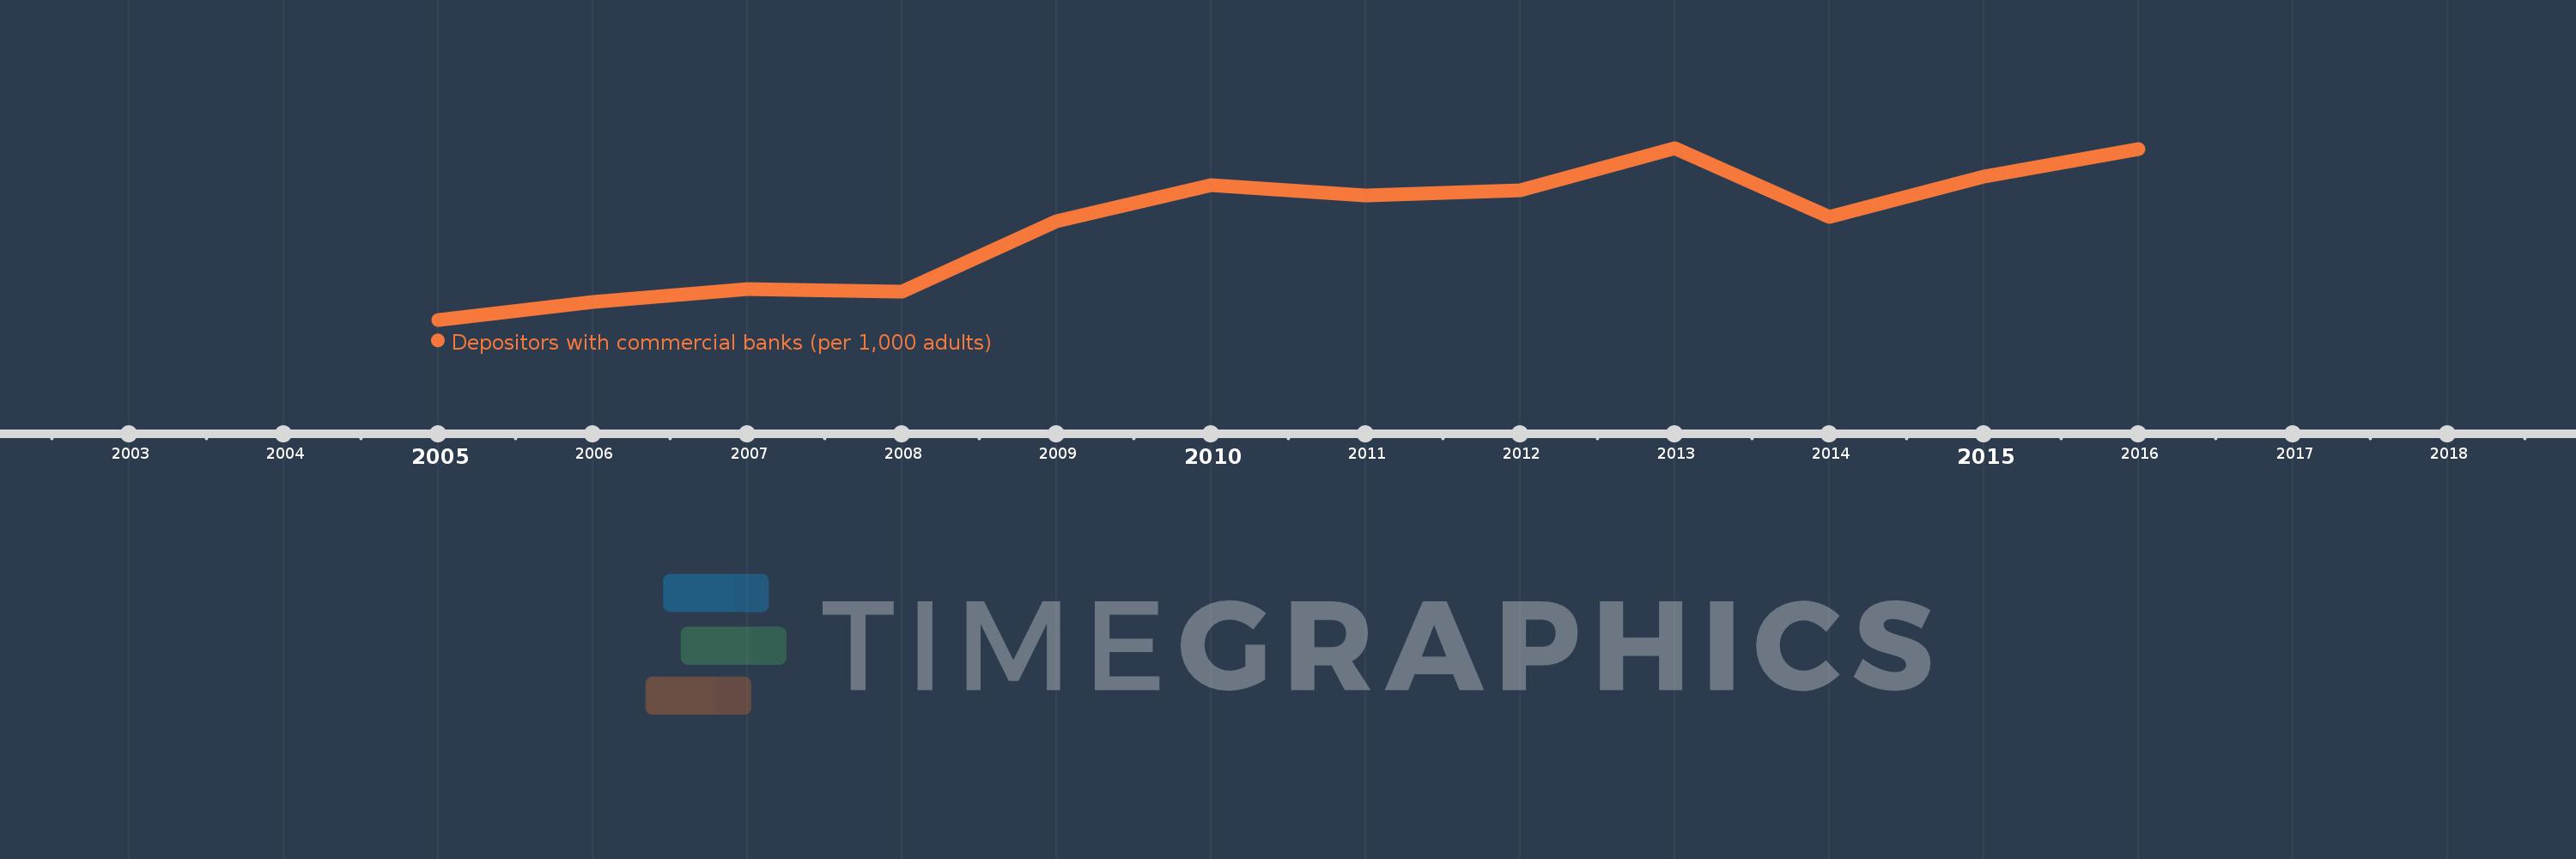
Depositors with commercial banks (per 1,000 adults)
2016,2015,2014,2013,2012,2011,2010,2009,2008,2007,2006,2005
This statistics in other country:
Timeline:
This timeline shows a graph from 2005 to 2016 of Swaziland. No data until 2004. Number of actual observations by date: 12.
Source name:
World Development Indicators
Source organization:
International Monetary Fund, Financial Access Survey.
Categories, topics:
Financial Sector
Last updated:
apr 23, 2017
Indicators value changes by year
Minimum:
342.754
jan 1, 2005
Maximum:
488.883
jan 1, 2013
At the date of observation
Value
Absolute change
Change from previous value
jan 1, 2005
342.754
+342.754
0.0%
jan 1, 2006
358.103
+15.348
4.48%
jan 1, 2007
368.639
+10.536
2.94%
jan 1, 2008
366.398
-2.241
-0.61%
jan 1, 2009
426.429
+60.031
16.38%
jan 1, 2010
457.225
+30.796
7.22%
jan 1, 2011
448.454
-8.771
-1.92%
jan 1, 2012
453.011
+4.557
1.02%
jan 1, 2013
488.883
+35.872
7.92%
jan 1, 2014
429.85
-59.032
-12.07%
jan 1, 2015
464.427
+34.577
8.04%
jan 1, 2016
487.605
+23.177
4.99%
Ranking of countries by current statistics by years


Comments: