29
/
en
AIzaSyAYiBZKx7MnpbEhh9jyipgxe19OcubqV5w
April 1, 2024
259426
Tajikistan
TJK
true
2
1
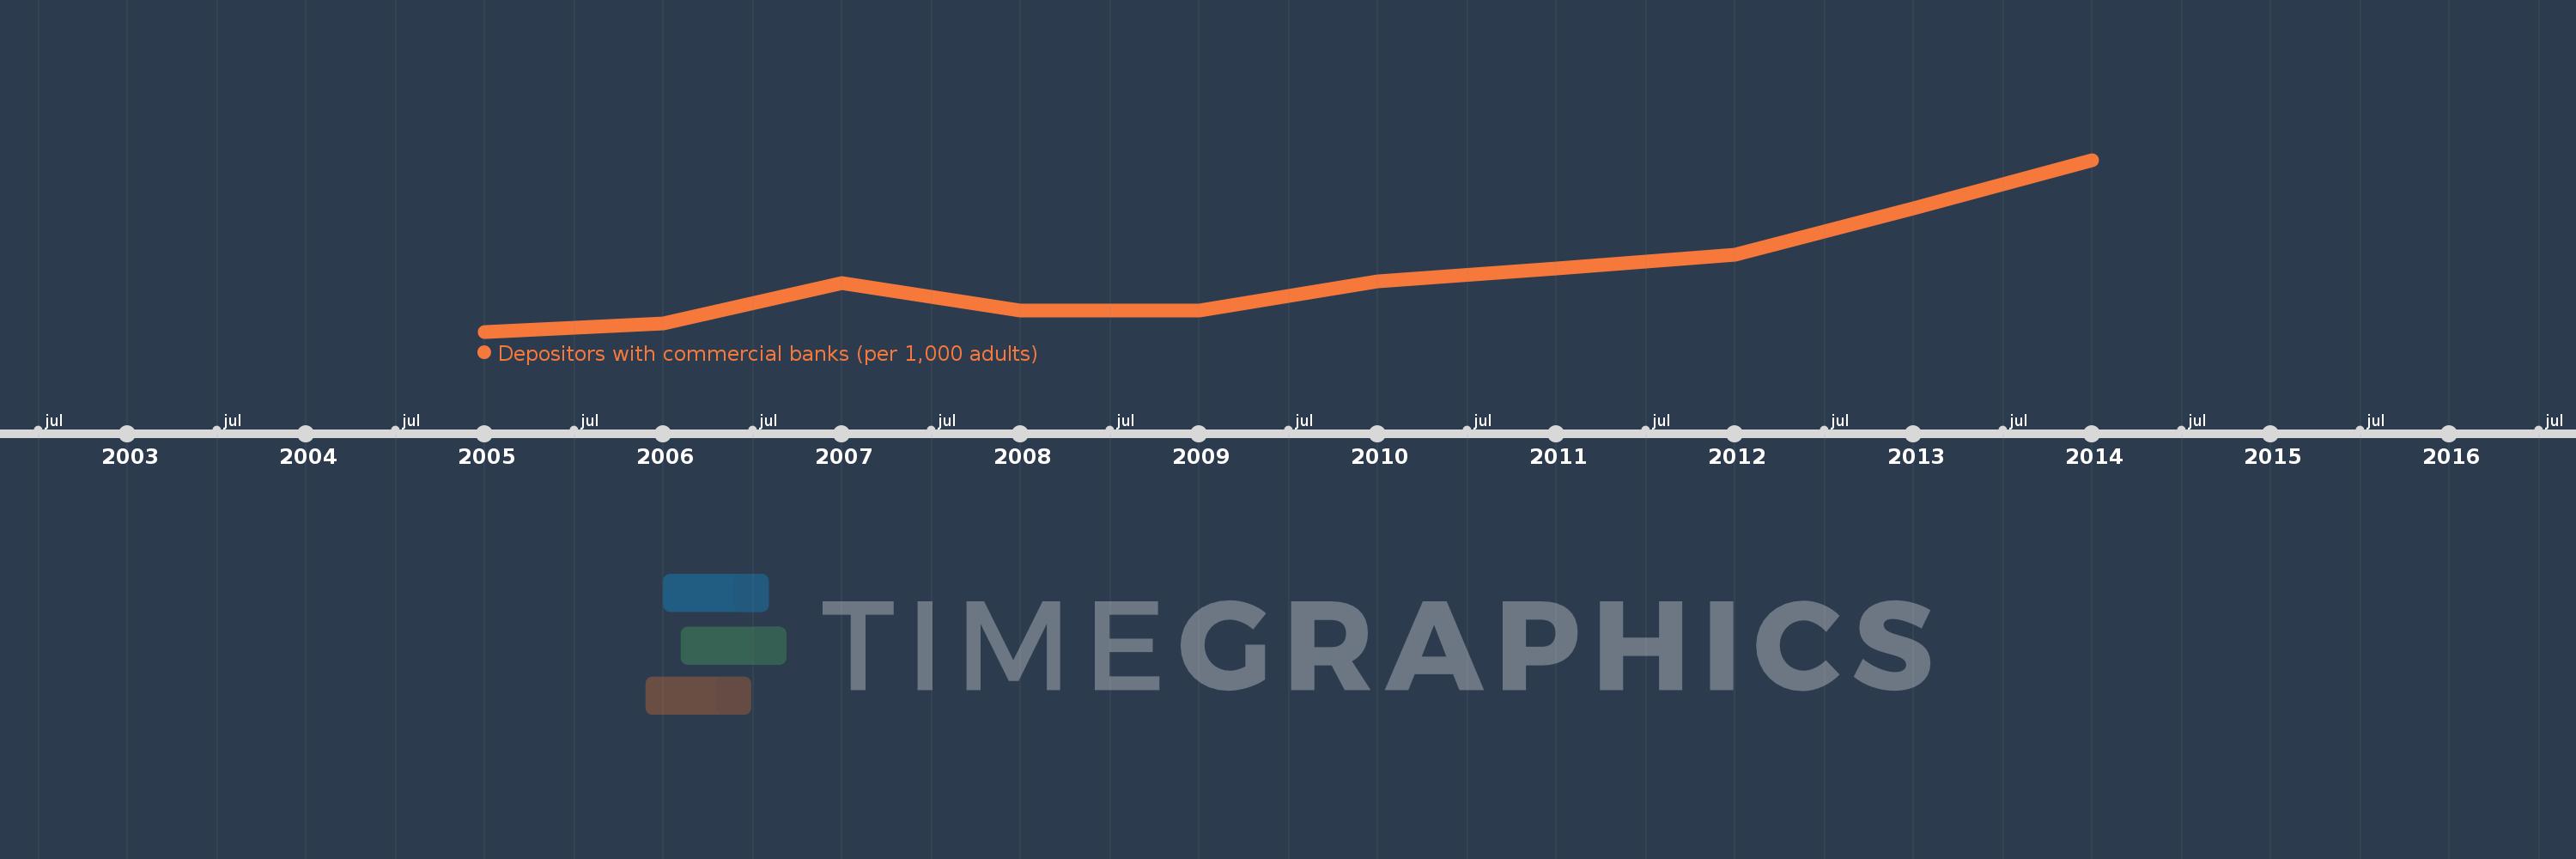
Depositors with commercial banks (per 1,000 adults)
2014,2013,2012,2011,2010,2009,2008,2007,2006,2005
This statistics in other country:
Timeline:
This timeline shows a graph from 2005 to 2014 of Tajikistan. No data until 2004. Number of actual observations by date: 10.
Source name:
World Development Indicators
Source organization:
International Monetary Fund, Financial Access Survey.
Categories, topics:
Financial Sector
Last updated:
apr 23, 2017
Indicators value changes by year
Maximum:
701.98
jan 1, 2014
At the date of observation
Value
Absolute change
Change from previous value
jan 1, 2005
172.4
+172.4
0.0%
jan 1, 2006
197.119
+24.719
14.34%
jan 1, 2007
323.027
+125.908
63.87%
jan 1, 2008
238.227
-84.8
-26.25%
jan 1, 2009
236.001
-2.225
-0.93%
jan 1, 2010
326.186
+90.185
38.21%
jan 1, 2011
366.795
+40.609
12.45%
jan 1, 2012
410.55
+43.755
11.93%
jan 1, 2013
551.573
+141.023
34.35%
jan 1, 2014
701.98
+150.408
27.27%
Ranking of countries by current statistics by years


Comments: