29
/
en
AIzaSyAYiBZKx7MnpbEhh9jyipgxe19OcubqV5w
April 1, 2024
83912
Benin
BEN
true
2
1
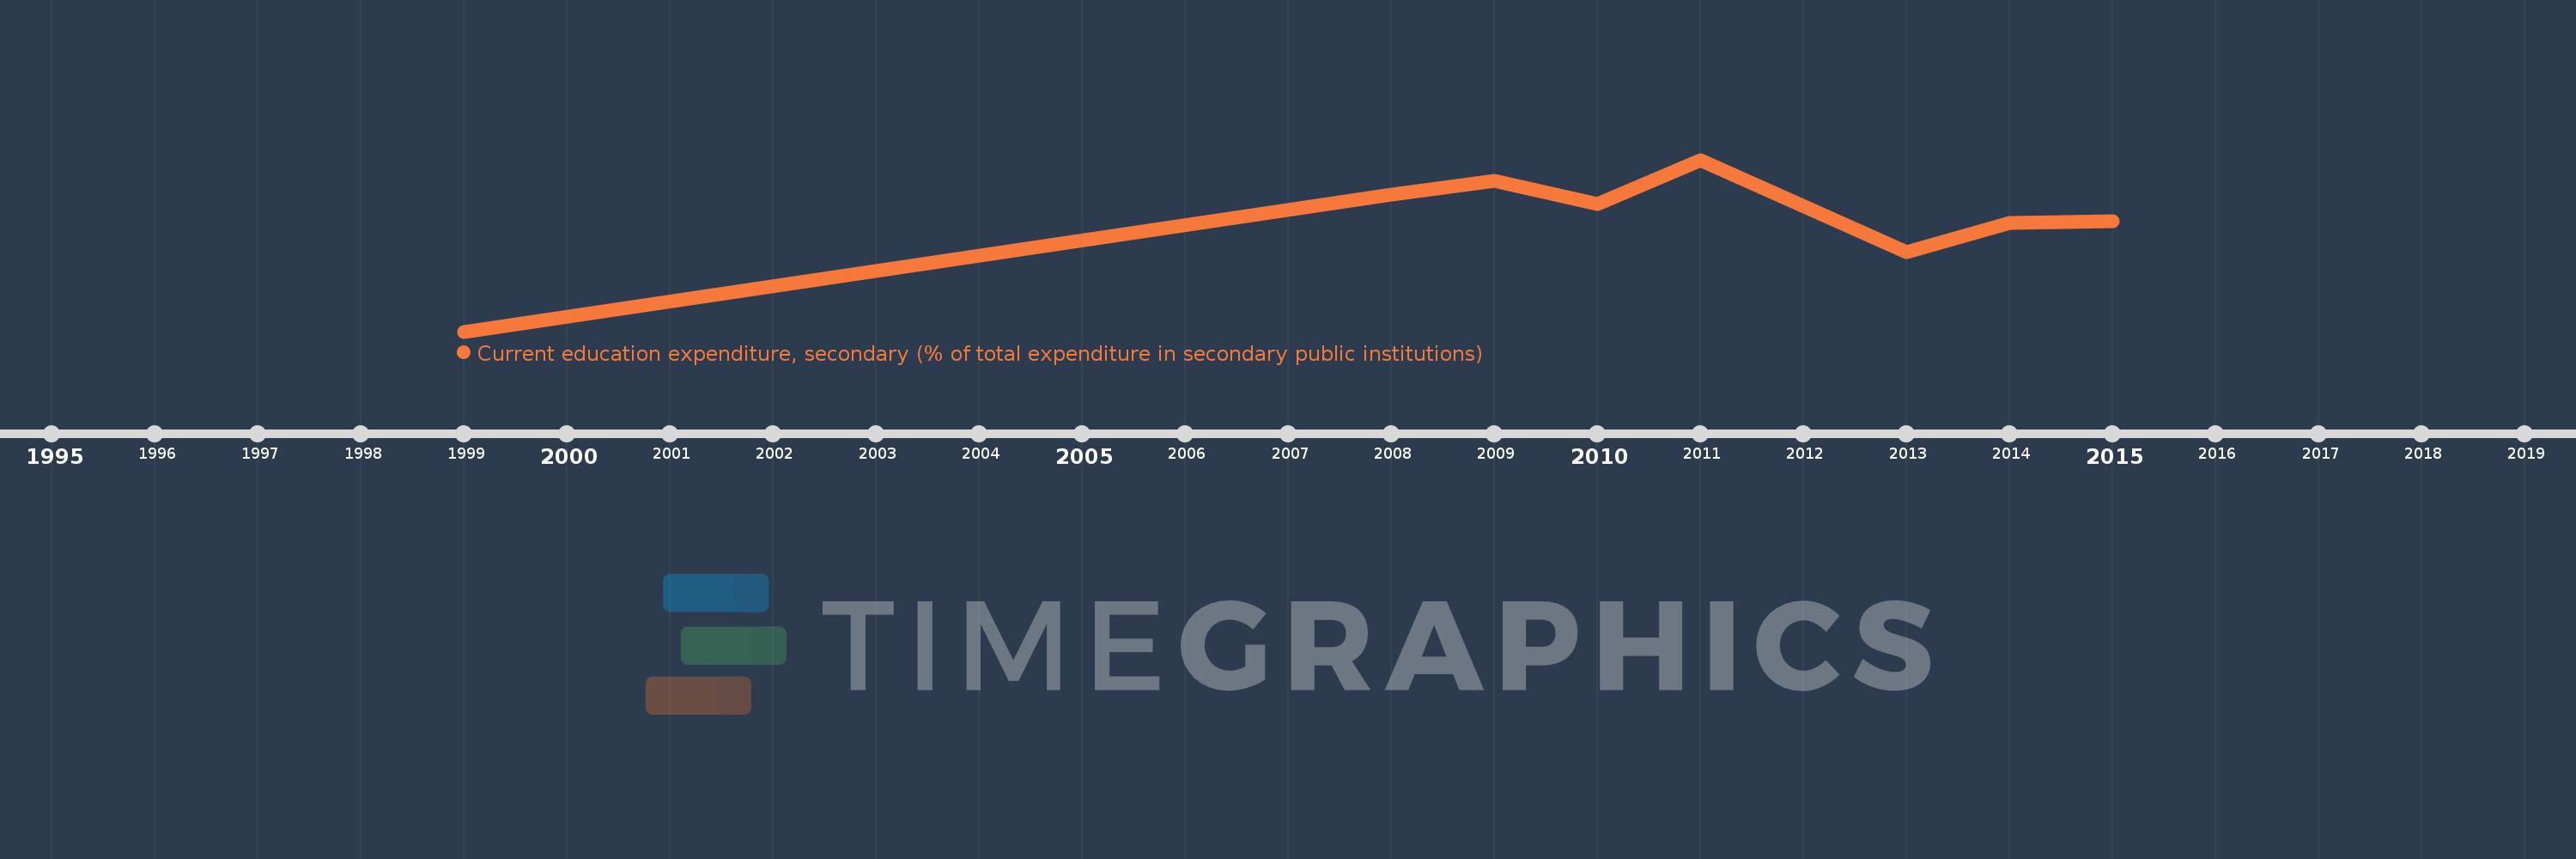
Current education expenditure, secondary (% of total expenditure in secondary public institutions)
2015,2014,2013,2011,2010,2009,2008,1999
This statistics in other country:
Timeline:
This timeline shows a graph from 1999 to 2015 of Benin. No data until 1998. Number of actual observations by date: 8.
Source name:
World Development Indicators
Source organization:
United Nations Educational, Scientific, and Cultural Organization (UNESCO) Institute for Statistics.
Categories, topics:
Education
Last updated:
apr 23, 2017
Indicators value changes by year
Minimum:
84.169
jan 1, 1999
Maximum:
99.092
jan 1, 2011
At the date of observation
Value
Absolute change
Change from previous value
jan 1, 1999
84.169
+84.169
0.0%
jan 1, 2008
96.072
+11.903
14.14%
jan 1, 2009
97.265
+1.193
1.24%
jan 1, 2010
95.247
-2.018
-2.07%
jan 1, 2011
99.092
+3.845
4.04%
jan 1, 2013
91.052
-8.04
-8.11%
jan 1, 2014
93.609
+2.557
2.81%
jan 1, 2015
93.771
+0.163
0.17%
Ranking of countries by current statistics by years


Comments: