29
/
en
AIzaSyAYiBZKx7MnpbEhh9jyipgxe19OcubqV5w
April 1, 2024
221992
Peru
PER
true
2
1
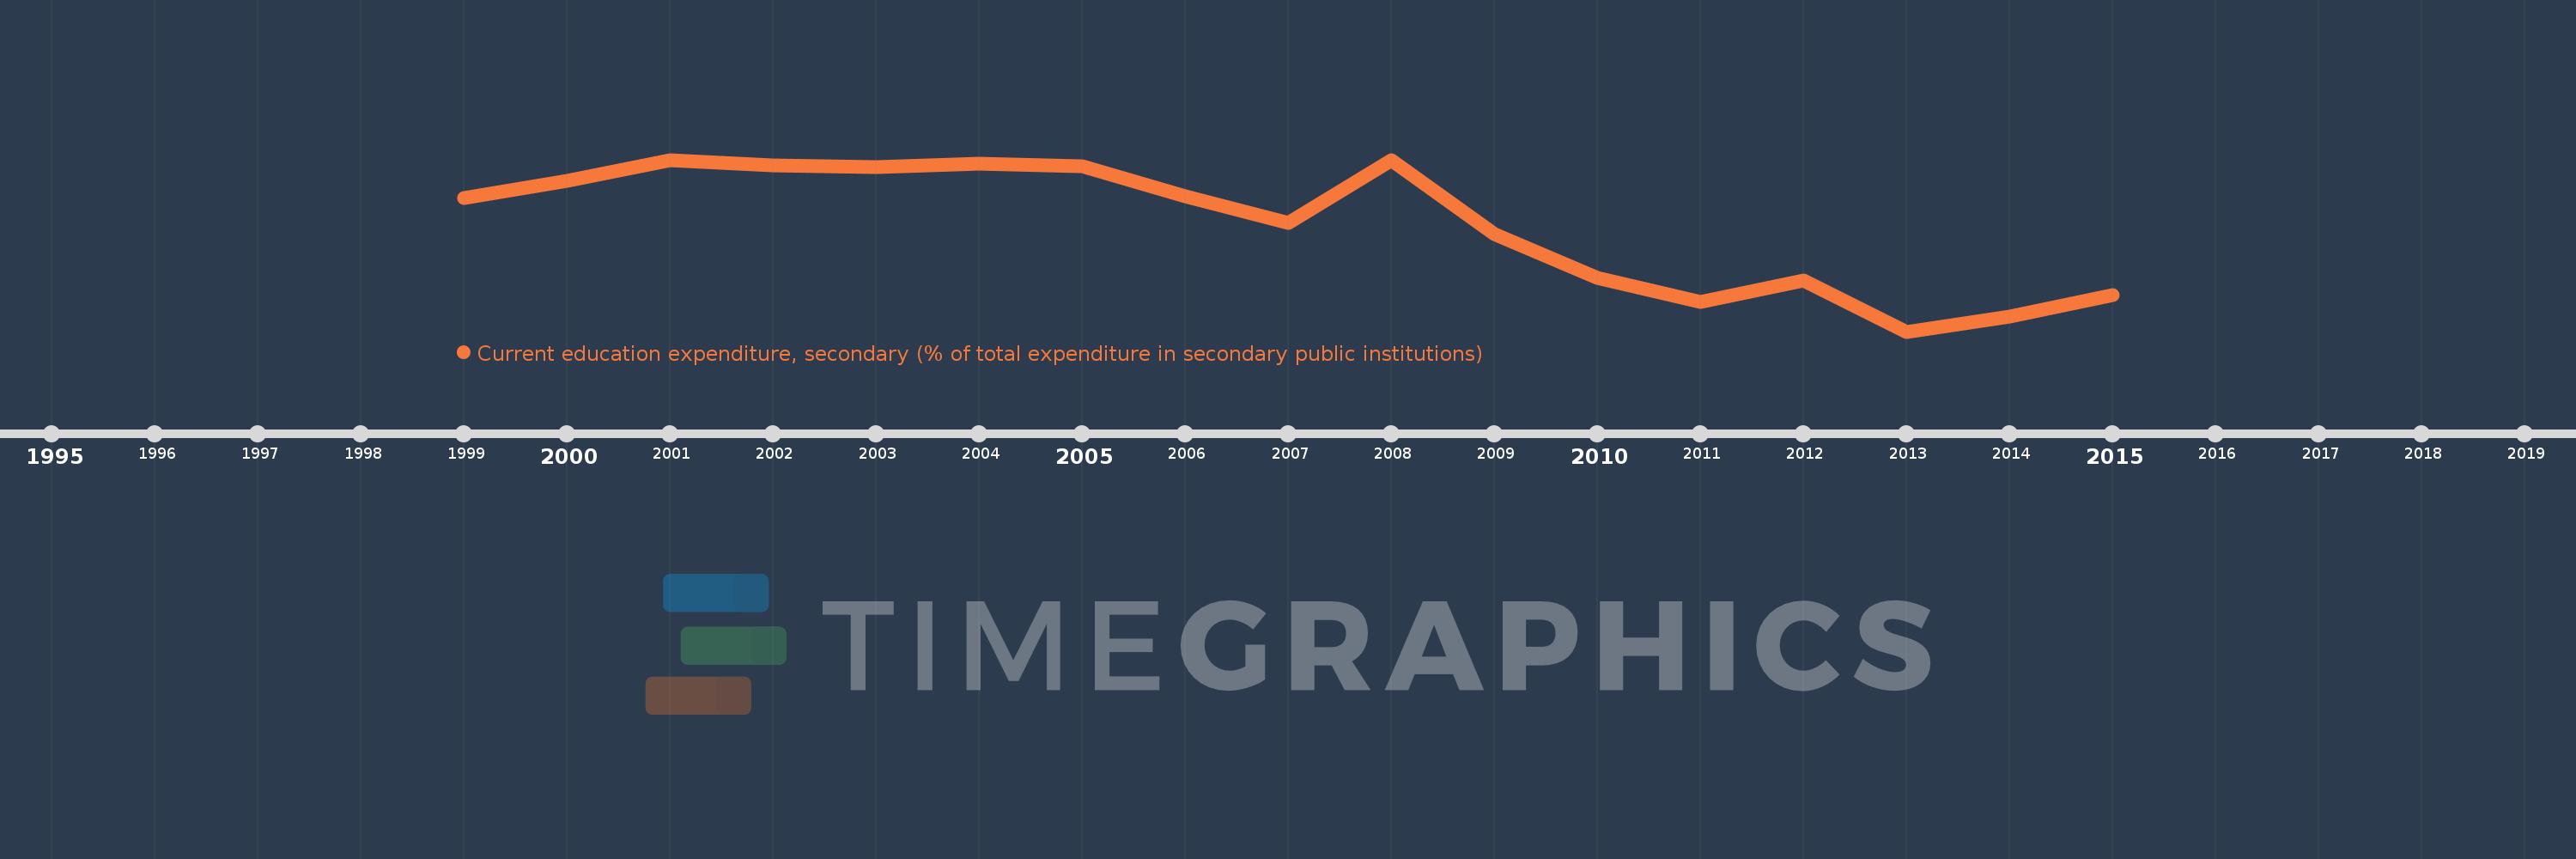
Current education expenditure, secondary (% of total expenditure in secondary public institutions)
2015,2014,2013,2012,2011,2010,2009,2008,2007,2006,2005,2004,2003,2002,2001,2000,1999
This statistics in other country:
Timeline:
This timeline shows a graph from 1999 to 2015 of Peru. No data until 1998. Number of actual observations by date: 17.
Source name:
World Development Indicators
Source organization:
United Nations Educational, Scientific, and Cultural Organization (UNESCO) Institute for Statistics.
Categories, topics:
Education
Last updated:
apr 23, 2017
Indicators value changes by year
Minimum:
72.849
jan 1, 2013
Maximum:
96.789
jan 1, 2008
At the date of observation
Value
Absolute change
Change from previous value
jan 1, 1999
91.495
+91.495
0.0%
jan 1, 2000
93.823
+2.328
2.54%
jan 1, 2001
96.733
+2.91
3.1%
jan 1, 2002
96.009
-0.723
-0.75%
jan 1, 2003
95.77
-0.239
-0.25%
jan 1, 2004
96.265
+0.495
0.52%
jan 1, 2005
95.875
-0.39
-0.41%
jan 1, 2006
91.645
-4.23
-4.41%
jan 1, 2007
88.011
-3.634
-3.97%
jan 1, 2008
96.789
+8.778
9.97%
jan 1, 2009
86.378
-10.411
-10.76%
jan 1, 2010
80.361
-6.017
-6.97%
jan 1, 2011
76.965
-3.396
-4.23%
jan 1, 2012
79.959
+2.993
3.89%
jan 1, 2013
72.849
-7.11
-8.89%
jan 1, 2014
74.983
+2.134
2.93%
jan 1, 2015
77.879
+2.896
3.86%
Ranking of countries by current statistics by years


Comments: