29
/
en
AIzaSyAYiBZKx7MnpbEhh9jyipgxe19OcubqV5w
April 1, 2024
29747
Euro area
EMU
false
2
1
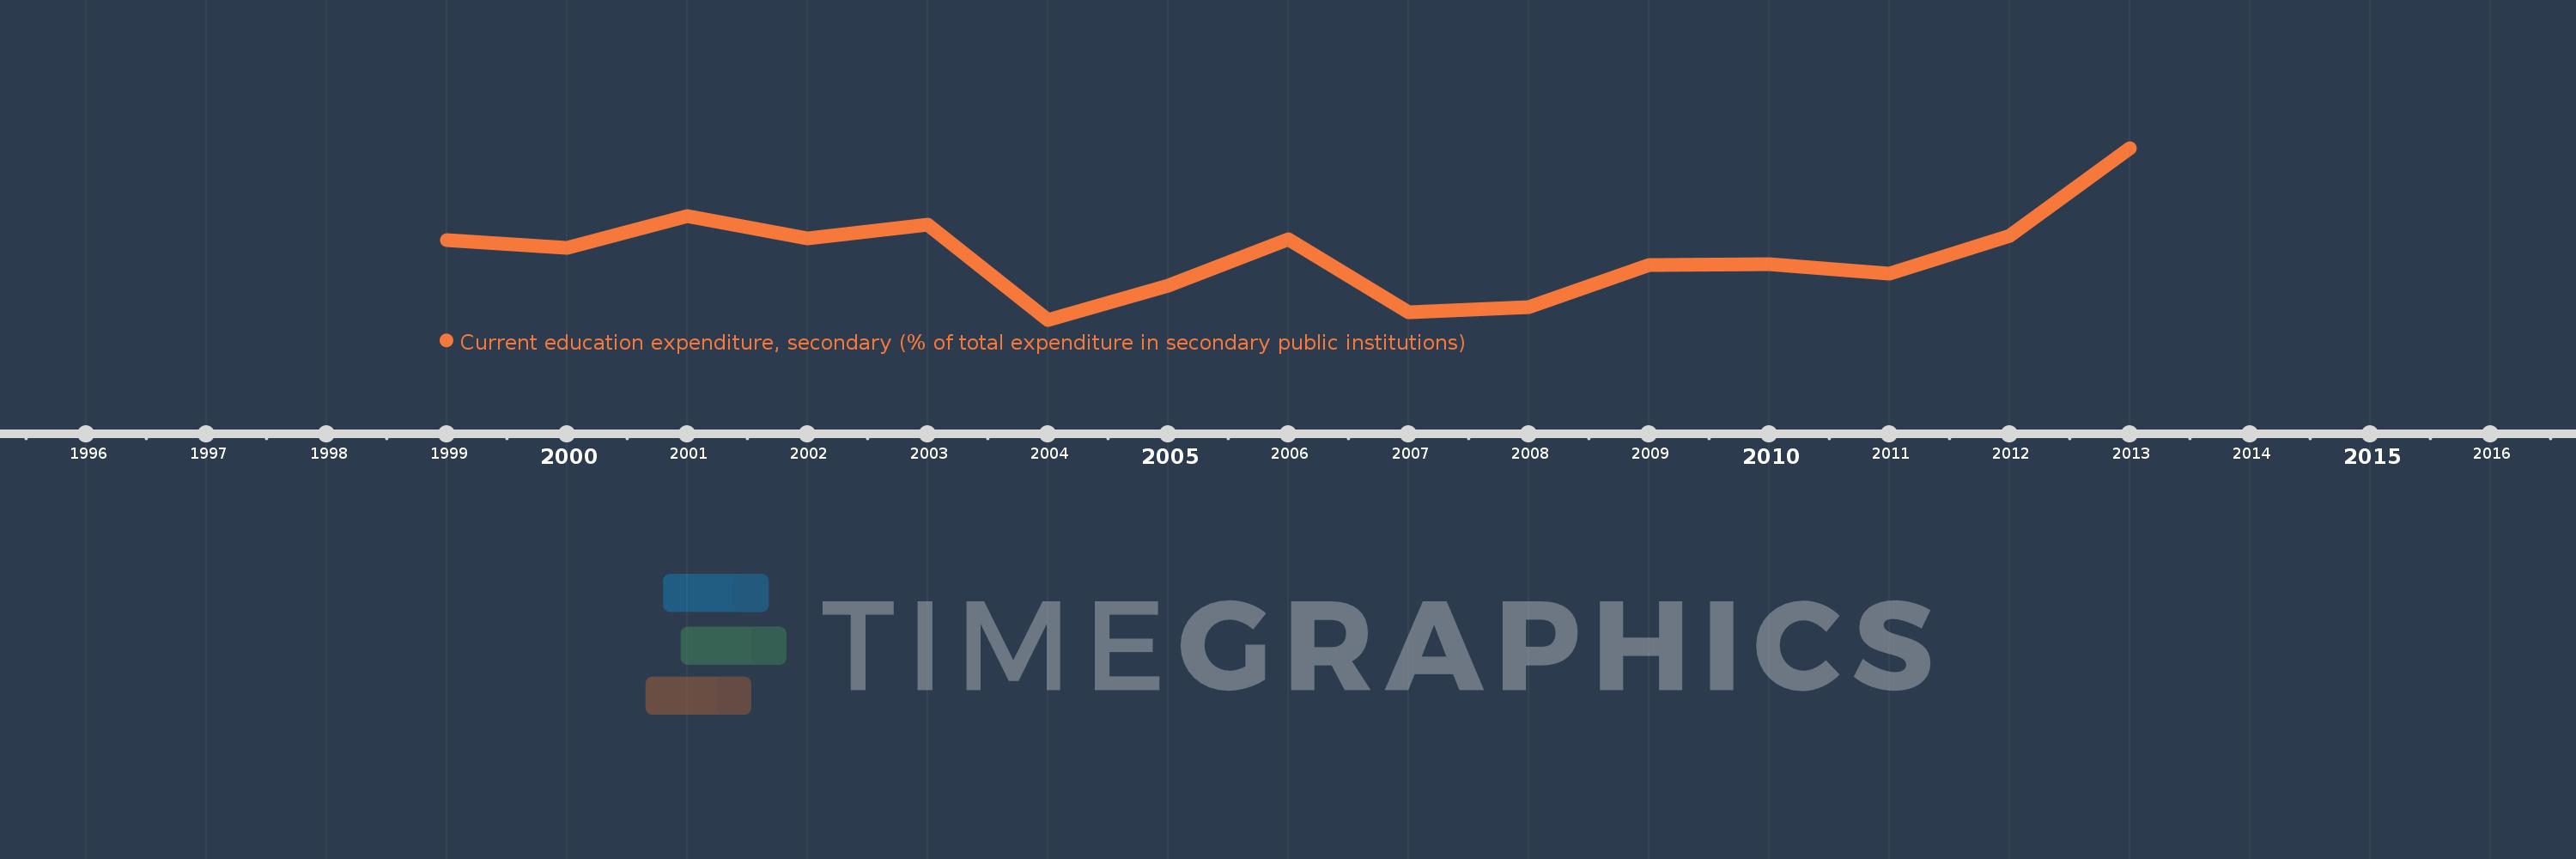
Current education expenditure, secondary (% of total expenditure in secondary public institutions)
2013,2012,2011,2010,2009,2008,2007,2006,2005,2004,2003,2002,2001,2000,1999
This statistics in other country:
Timeline:
This timeline shows a graph from 1999 to 2013 of Euro area. No data until 1998. Number of actual observations by date: 15.
Source name:
World Development Indicators
Source organization:
United Nations Educational, Scientific, and Cultural Organization (UNESCO) Institute for Statistics.
Categories, topics:
Education
Last updated:
apr 23, 2017
Indicators value changes by year
Minimum:
91.065
jan 1, 2004
Maximum:
95.642
jan 1, 2013
At the date of observation
Value
Absolute change
Change from previous value
jan 1, 1999
93.191
+93.191
0.0%
jan 1, 2000
92.982
-0.21
-0.22%
jan 1, 2001
93.82
+0.839
0.9%
jan 1, 2002
93.238
-0.582
-0.62%
jan 1, 2003
93.604
+0.366
0.39%
jan 1, 2004
91.065
-2.54
-2.71%
jan 1, 2005
91.964
+0.899
0.99%
jan 1, 2006
93.214
+1.251
1.36%
jan 1, 2007
91.261
-1.954
-2.1%
jan 1, 2008
91.408
+0.148
0.16%
jan 1, 2009
92.513
+1.105
1.21%
jan 1, 2010
92.549
+0.036
0.04%
jan 1, 2011
92.299
-0.25
-0.27%
jan 1, 2012
93.296
+0.997
1.08%
jan 1, 2013
95.642
+2.347
2.52%
Ranking of countries by current statistics by years


Comments: