29
/
en
AIzaSyAYiBZKx7MnpbEhh9jyipgxe19OcubqV5w
April 1, 2024
95967
Burundi
BDI
true
2
1
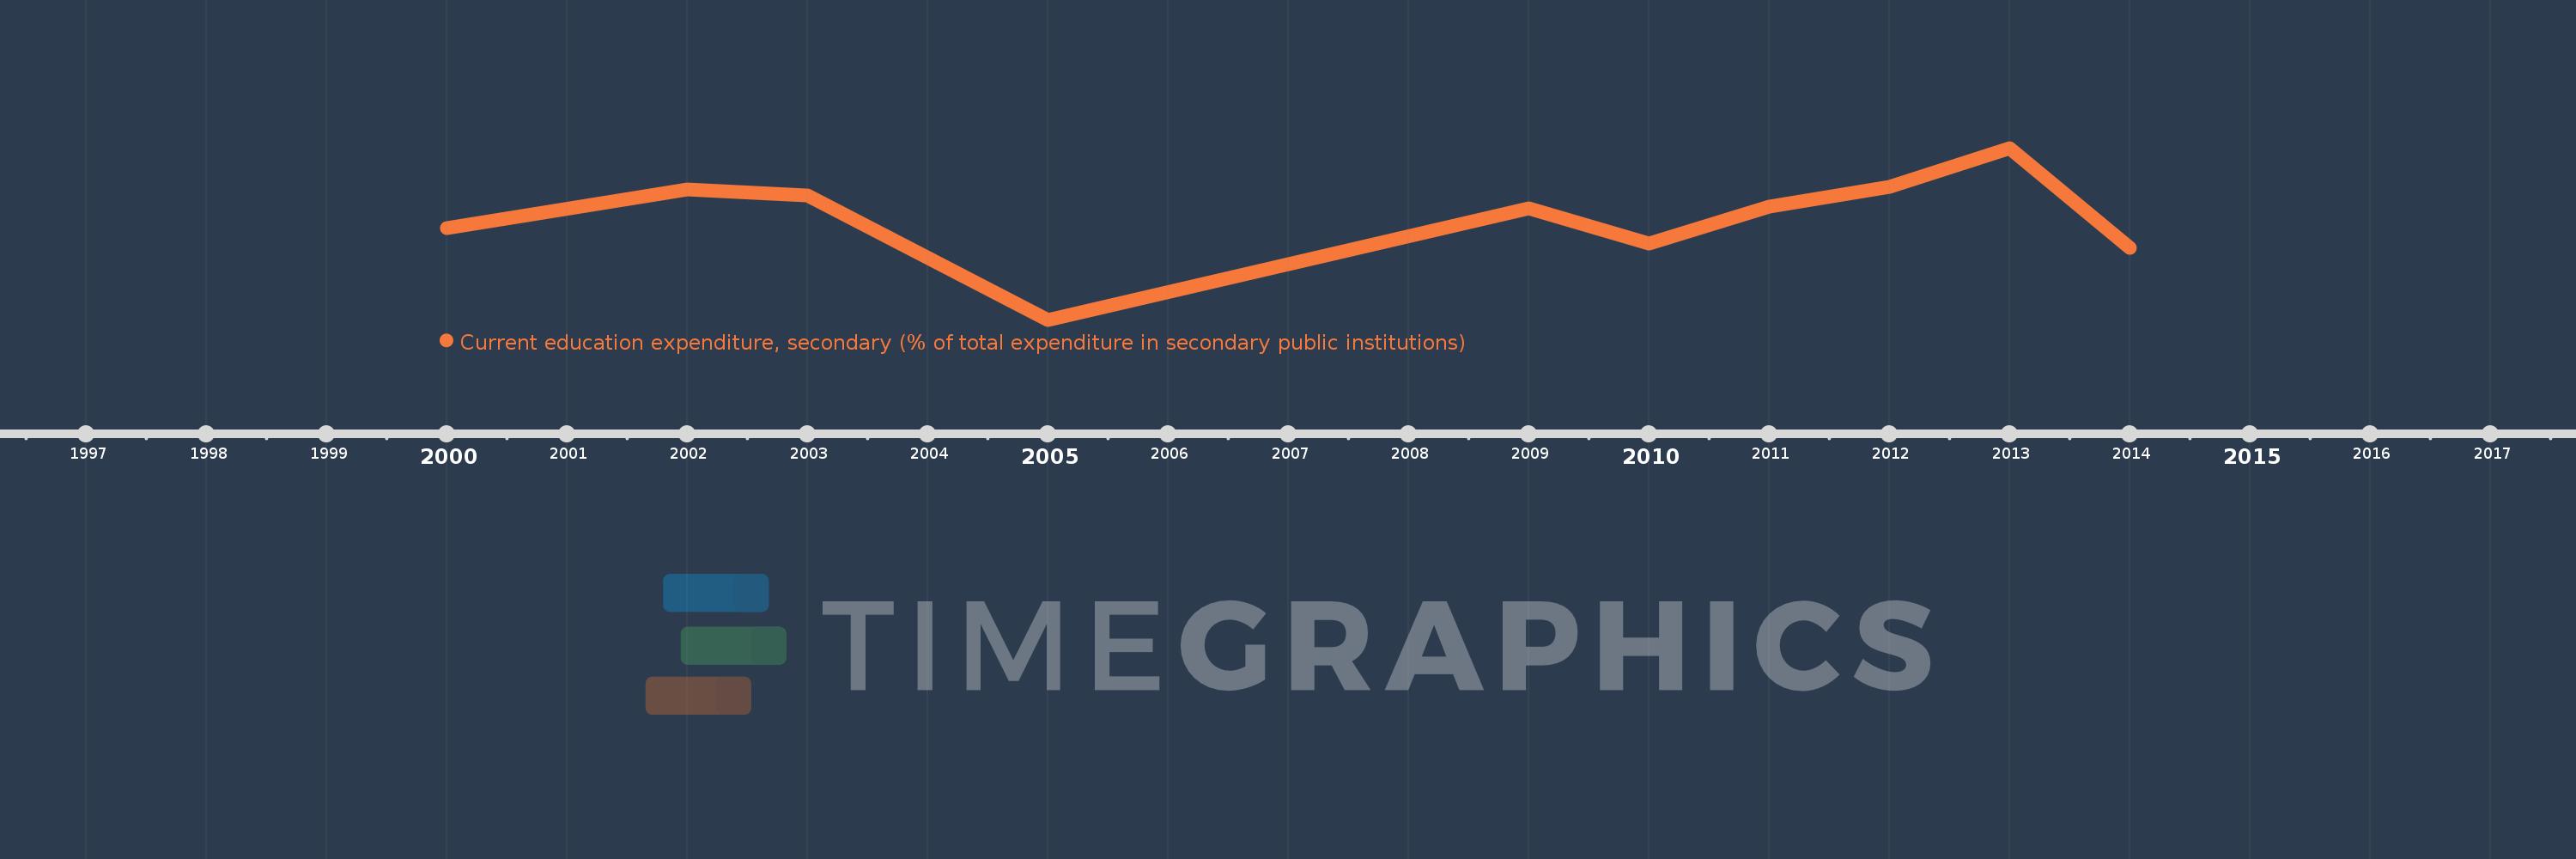
Current education expenditure, secondary (% of total expenditure in secondary public institutions)
2014,2013,2012,2011,2010,2009,2005,2003,2002,2000
This statistics in other country:
Timeline:
This timeline shows a graph from 2000 to 2014 of Burundi. No data until 1999. Number of actual observations by date: 10.
Source name:
World Development Indicators
Source organization:
United Nations Educational, Scientific, and Cultural Organization (UNESCO) Institute for Statistics.
Categories, topics:
Education
Last updated:
apr 23, 2017
Indicators value changes by year
Minimum:
79.088
jan 1, 2005
Maximum:
99.995
jan 1, 2013
At the date of observation
Value
Absolute change
Change from previous value
jan 1, 2000
90.192
+90.192
0.0%
jan 1, 2002
94.945
+4.753
5.27%
jan 1, 2003
94.194
-0.752
-0.79%
jan 1, 2005
79.088
-15.106
-16.04%
jan 1, 2009
92.63
+13.542
17.12%
jan 1, 2010
88.351
-4.278
-4.62%
jan 1, 2011
92.813
+4.461
5.05%
jan 1, 2012
95.234
+2.421
2.61%
jan 1, 2013
99.995
+4.761
5.0%
jan 1, 2014
87.875
-12.121
-12.12%
Ranking of countries by current statistics by years


Comments: