29
/
en
AIzaSyAYiBZKx7MnpbEhh9jyipgxe19OcubqV5w
April 1, 2024
35630
High income
HIC
false
2
1
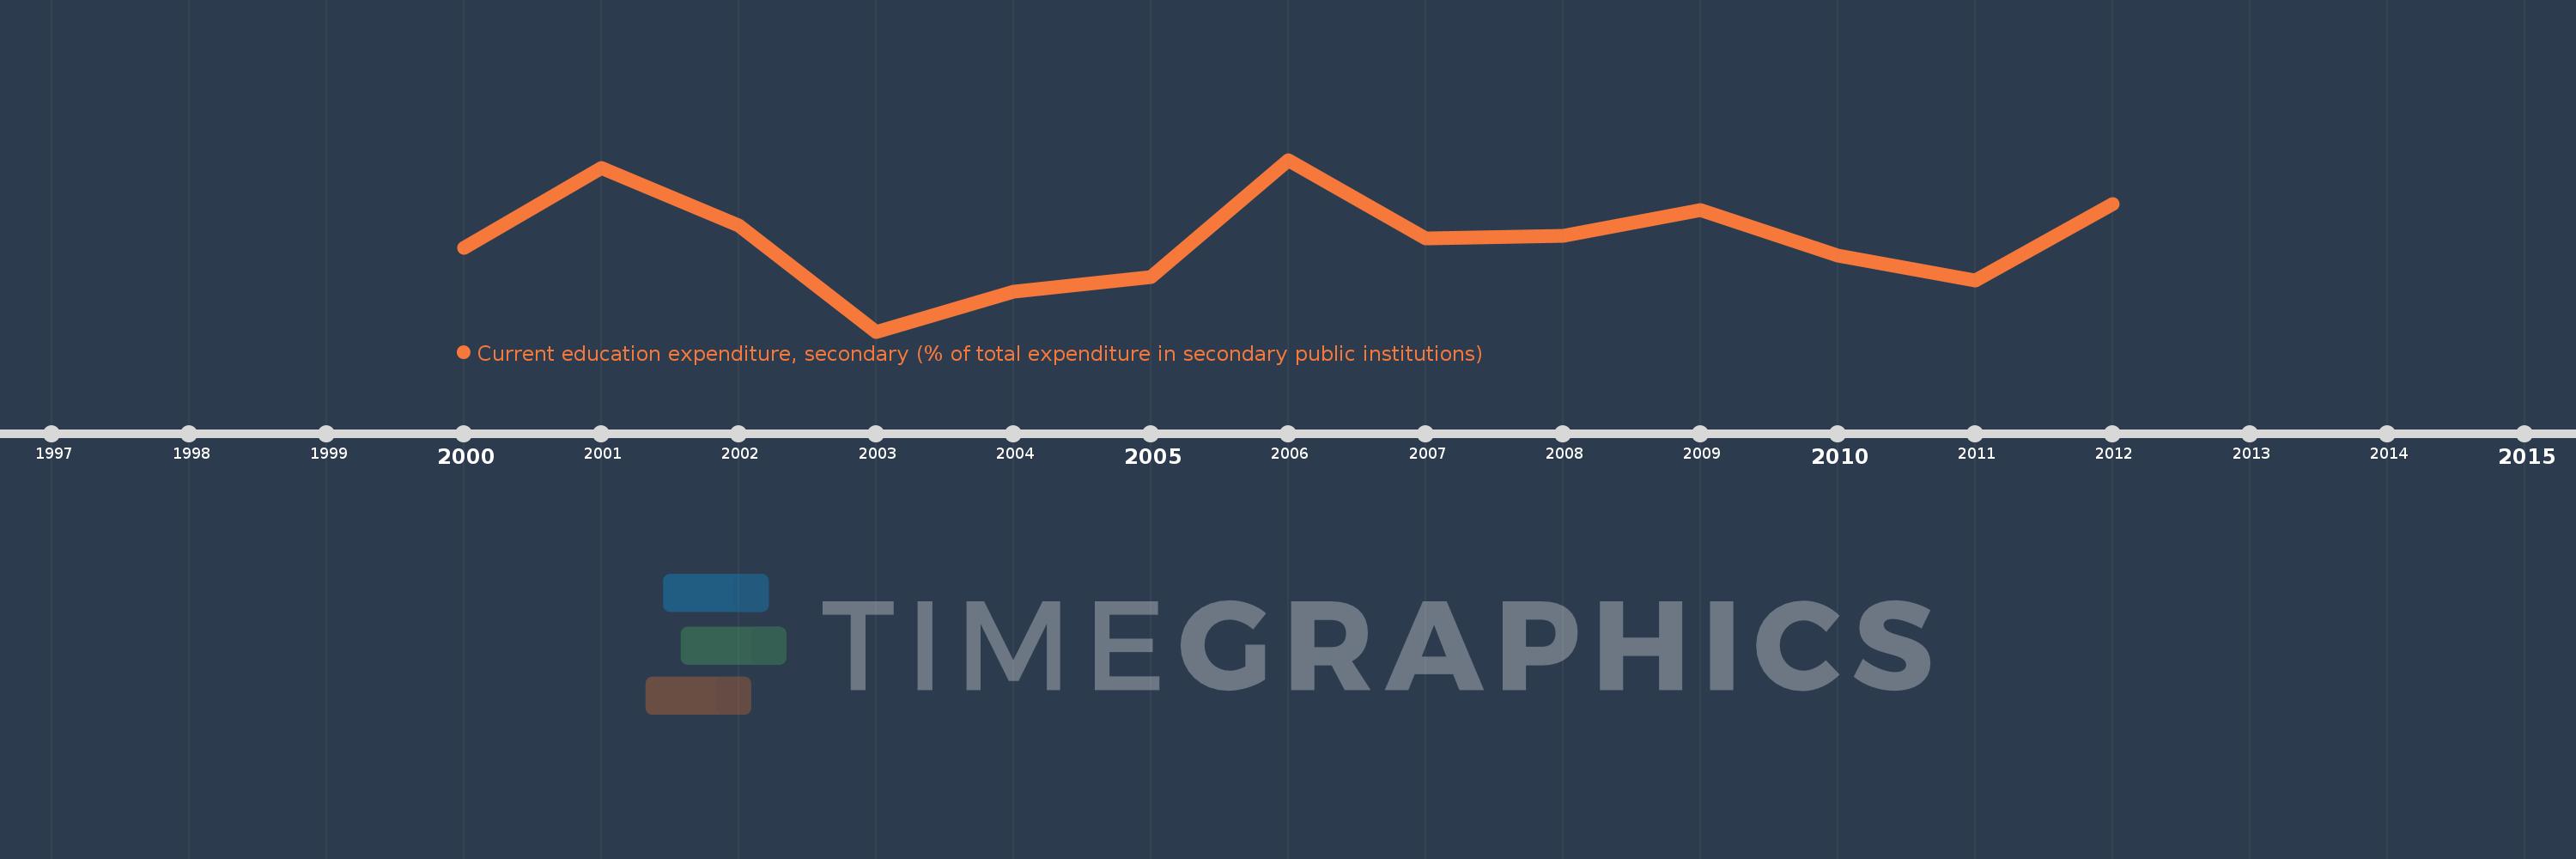
Current education expenditure, secondary (% of total expenditure in secondary public institutions)
2012,2011,2010,2009,2008,2007,2006,2005,2004,2003,2002,2001,2000
This statistics in other country:
Timeline:
This timeline shows a graph from 2000 to 2012 of High income. No data until 1999. Number of actual observations by date: 13.
Source name:
World Development Indicators
Source organization:
United Nations Educational, Scientific, and Cultural Organization (UNESCO) Institute for Statistics.
Categories, topics:
Education
Last updated:
apr 23, 2017
Indicators value changes by year
Minimum:
91.052
jan 1, 2003
Maximum:
93.214
jan 1, 2006
At the date of observation
Value
Absolute change
Change from previous value
jan 1, 2000
92.105
+92.105
0.0%
jan 1, 2001
93.111
+1.006
1.09%
jan 1, 2002
92.383
-0.728
-0.78%
jan 1, 2003
91.052
-1.331
-1.44%
jan 1, 2004
91.559
+0.507
0.56%
jan 1, 2005
91.735
+0.176
0.19%
jan 1, 2006
93.214
+1.479
1.61%
jan 1, 2007
92.225
-0.99
-1.06%
jan 1, 2008
92.258
+0.033
0.04%
jan 1, 2009
92.583
+0.326
0.35%
jan 1, 2010
92.008
-0.575
-0.62%
jan 1, 2011
91.694
-0.315
-0.34%
jan 1, 2012
92.66
+0.967
1.05%
Ranking of countries by current statistics by years


Comments: