29
/
en
AIzaSyAYiBZKx7MnpbEhh9jyipgxe19OcubqV5w
April 1, 2024
153399
Iceland
ISL
true
2
1
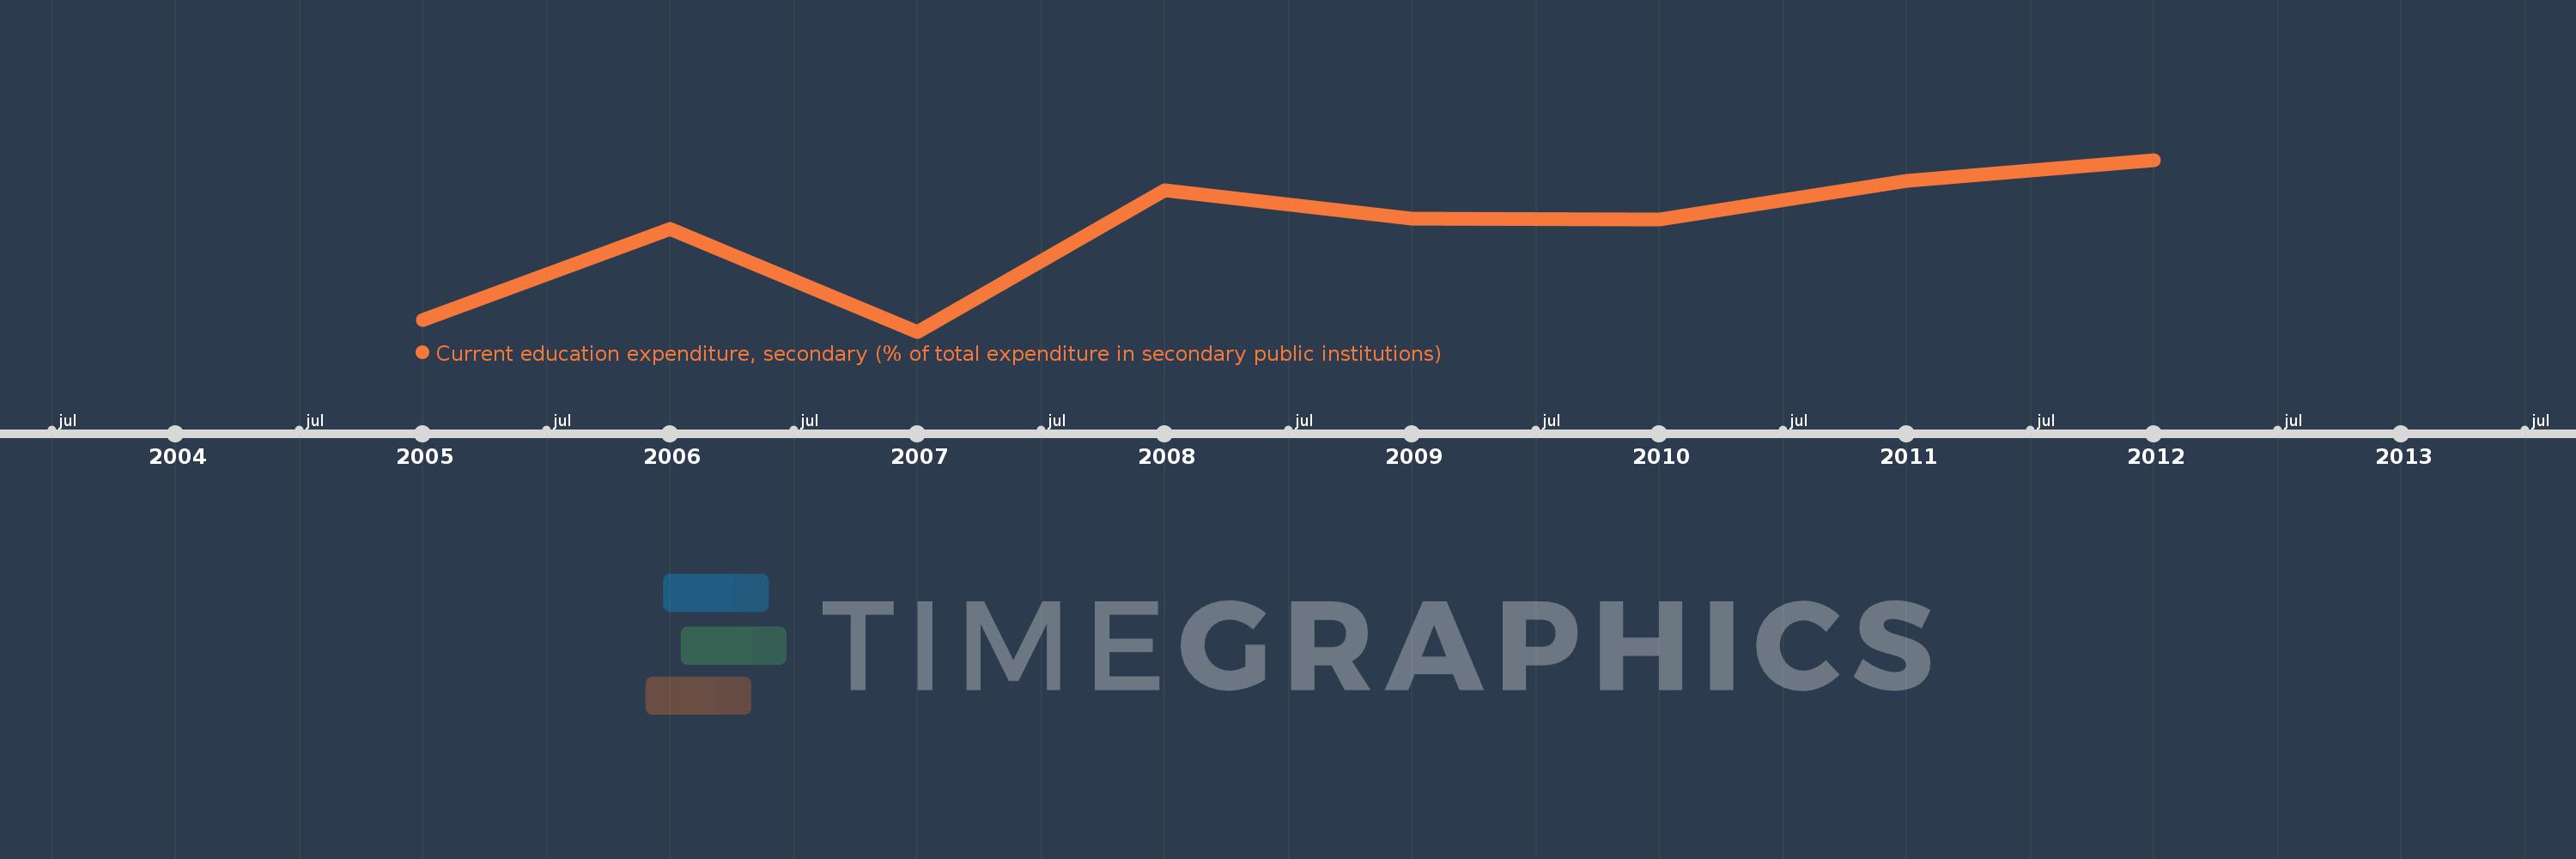
Current education expenditure, secondary (% of total expenditure in secondary public institutions)
2012,2011,2010,2009,2008,2007,2006,2005
This statistics in other country:
Timeline:
This timeline shows a graph from 2005 to 2012 of Iceland. No data until 2004. Number of actual observations by date: 8.
Source name:
World Development Indicators
Source organization:
United Nations Educational, Scientific, and Cultural Organization (UNESCO) Institute for Statistics.
Categories, topics:
Education
Last updated:
apr 23, 2017
Indicators value changes by year
Minimum:
89.806
jan 1, 2007
Maximum:
94.705
jan 1, 2012
At the date of observation
Value
Absolute change
Change from previous value
jan 1, 2005
90.148
+90.148
0.0%
jan 1, 2006
92.741
+2.593
2.88%
jan 1, 2007
89.806
-2.935
-3.17%
jan 1, 2008
93.833
+4.027
4.48%
jan 1, 2009
93.034
-0.799
-0.85%
jan 1, 2010
93.011
-0.023
-0.03%
jan 1, 2011
94.104
+1.093
1.17%
jan 1, 2012
94.705
+0.601
0.64%
Ranking of countries by current statistics by years


Comments: