29
/
en
AIzaSyAYiBZKx7MnpbEhh9jyipgxe19OcubqV5w
April 1, 2024
274633
United Arab Emirates
ARE
true
2
1
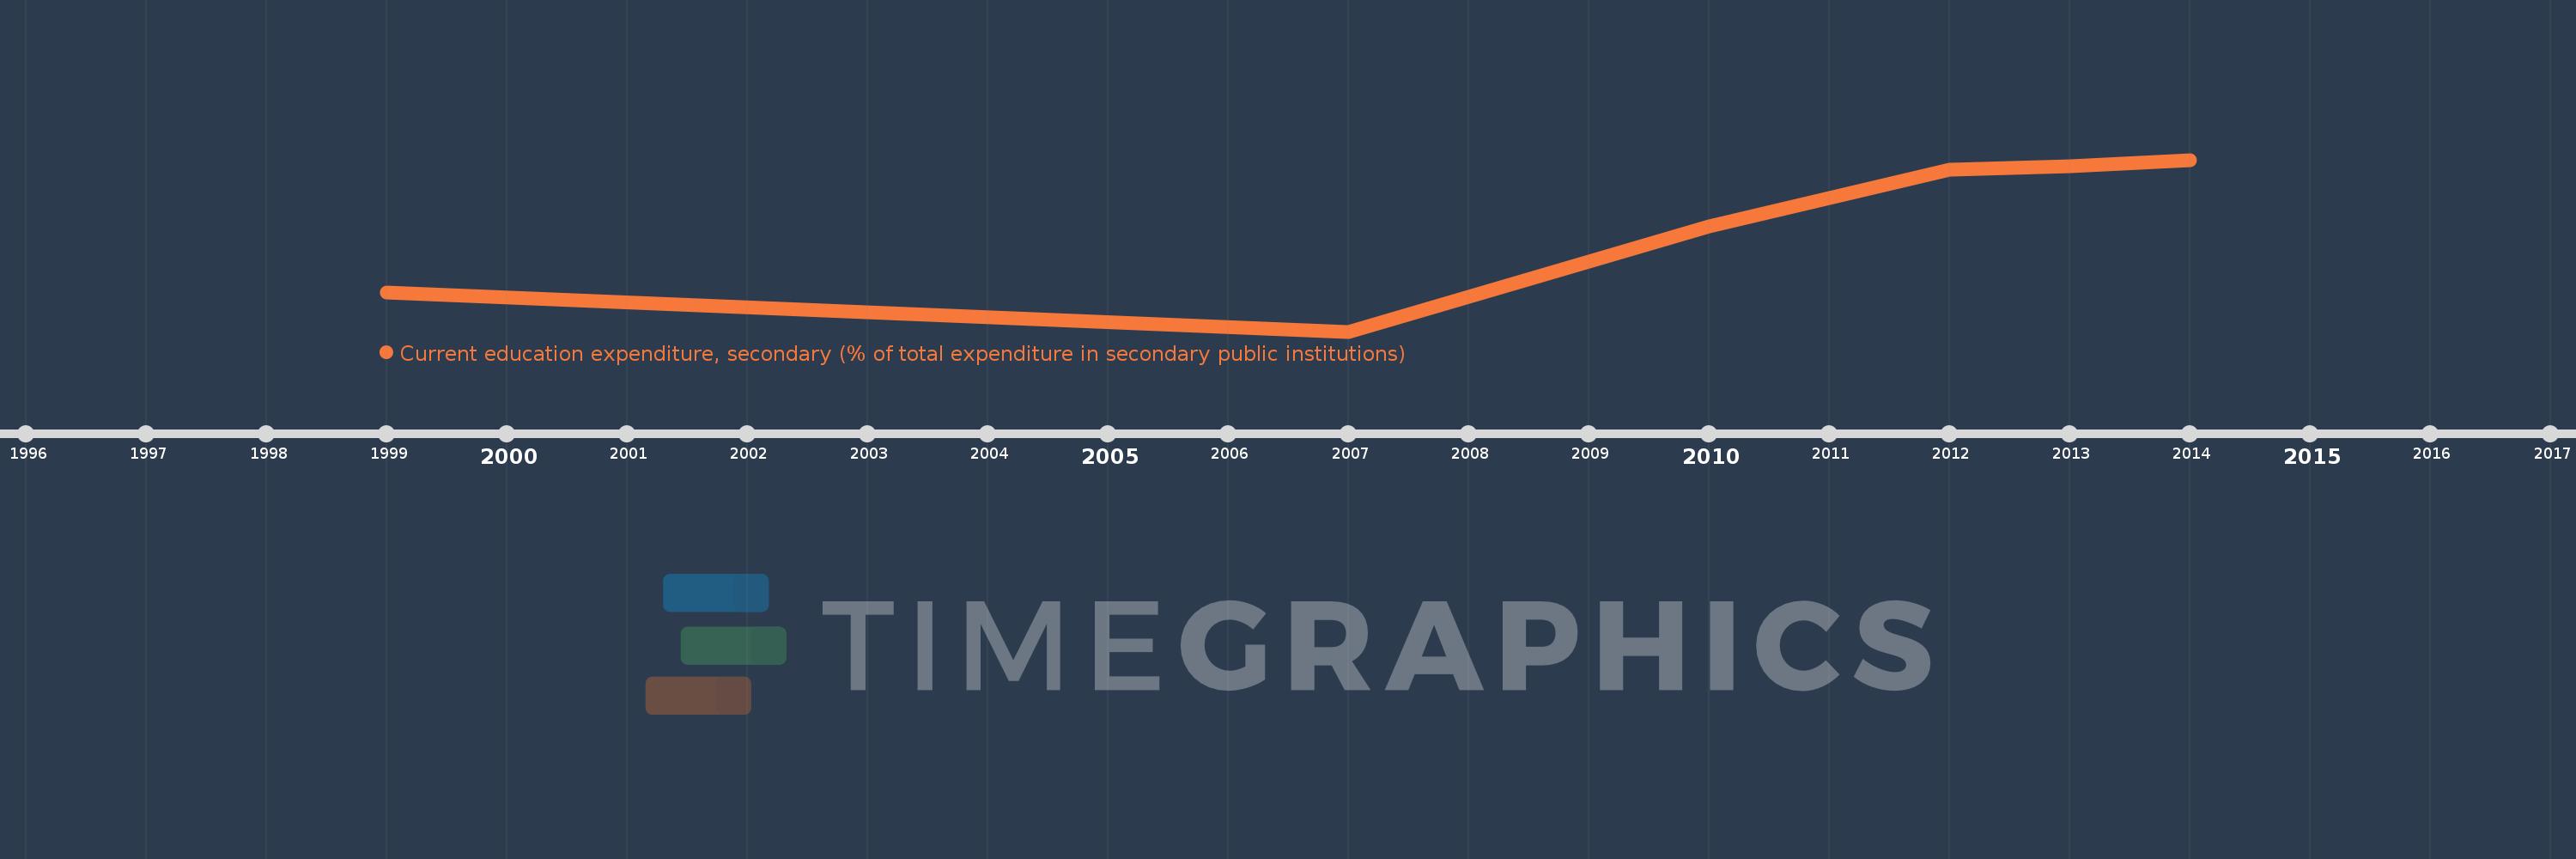
Current education expenditure, secondary (% of total expenditure in secondary public institutions)
2014,2013,2012,2010,2007,1999
This statistics in other country:
Timeline:
This timeline shows a graph from 1999 to 2014 of United Arab Emirates. No data until 1998. Number of actual observations by date: 6.
Source name:
World Development Indicators
Source organization:
United Nations Educational, Scientific, and Cultural Organization (UNESCO) Institute for Statistics.
Categories, topics:
Education
Last updated:
apr 23, 2017
Indicators value changes by year
Minimum:
89.719
jan 1, 2007
Maximum:
99.504
jan 1, 2014
At the date of observation
Value
Absolute change
Change from previous value
jan 1, 1999
91.938
+91.938
0.0%
jan 1, 2007
89.719
-2.219
-2.41%
jan 1, 2010
95.695
+5.976
6.66%
jan 1, 2012
98.956
+3.261
3.41%
jan 1, 2013
99.144
+0.188
0.19%
jan 1, 2014
99.504
+0.36
0.36%
Ranking of countries by current statistics by years


Comments: