29
/
en
AIzaSyAYiBZKx7MnpbEhh9jyipgxe19OcubqV5w
April 1, 2024
181941
Luxembourg
LUX
true
2
1
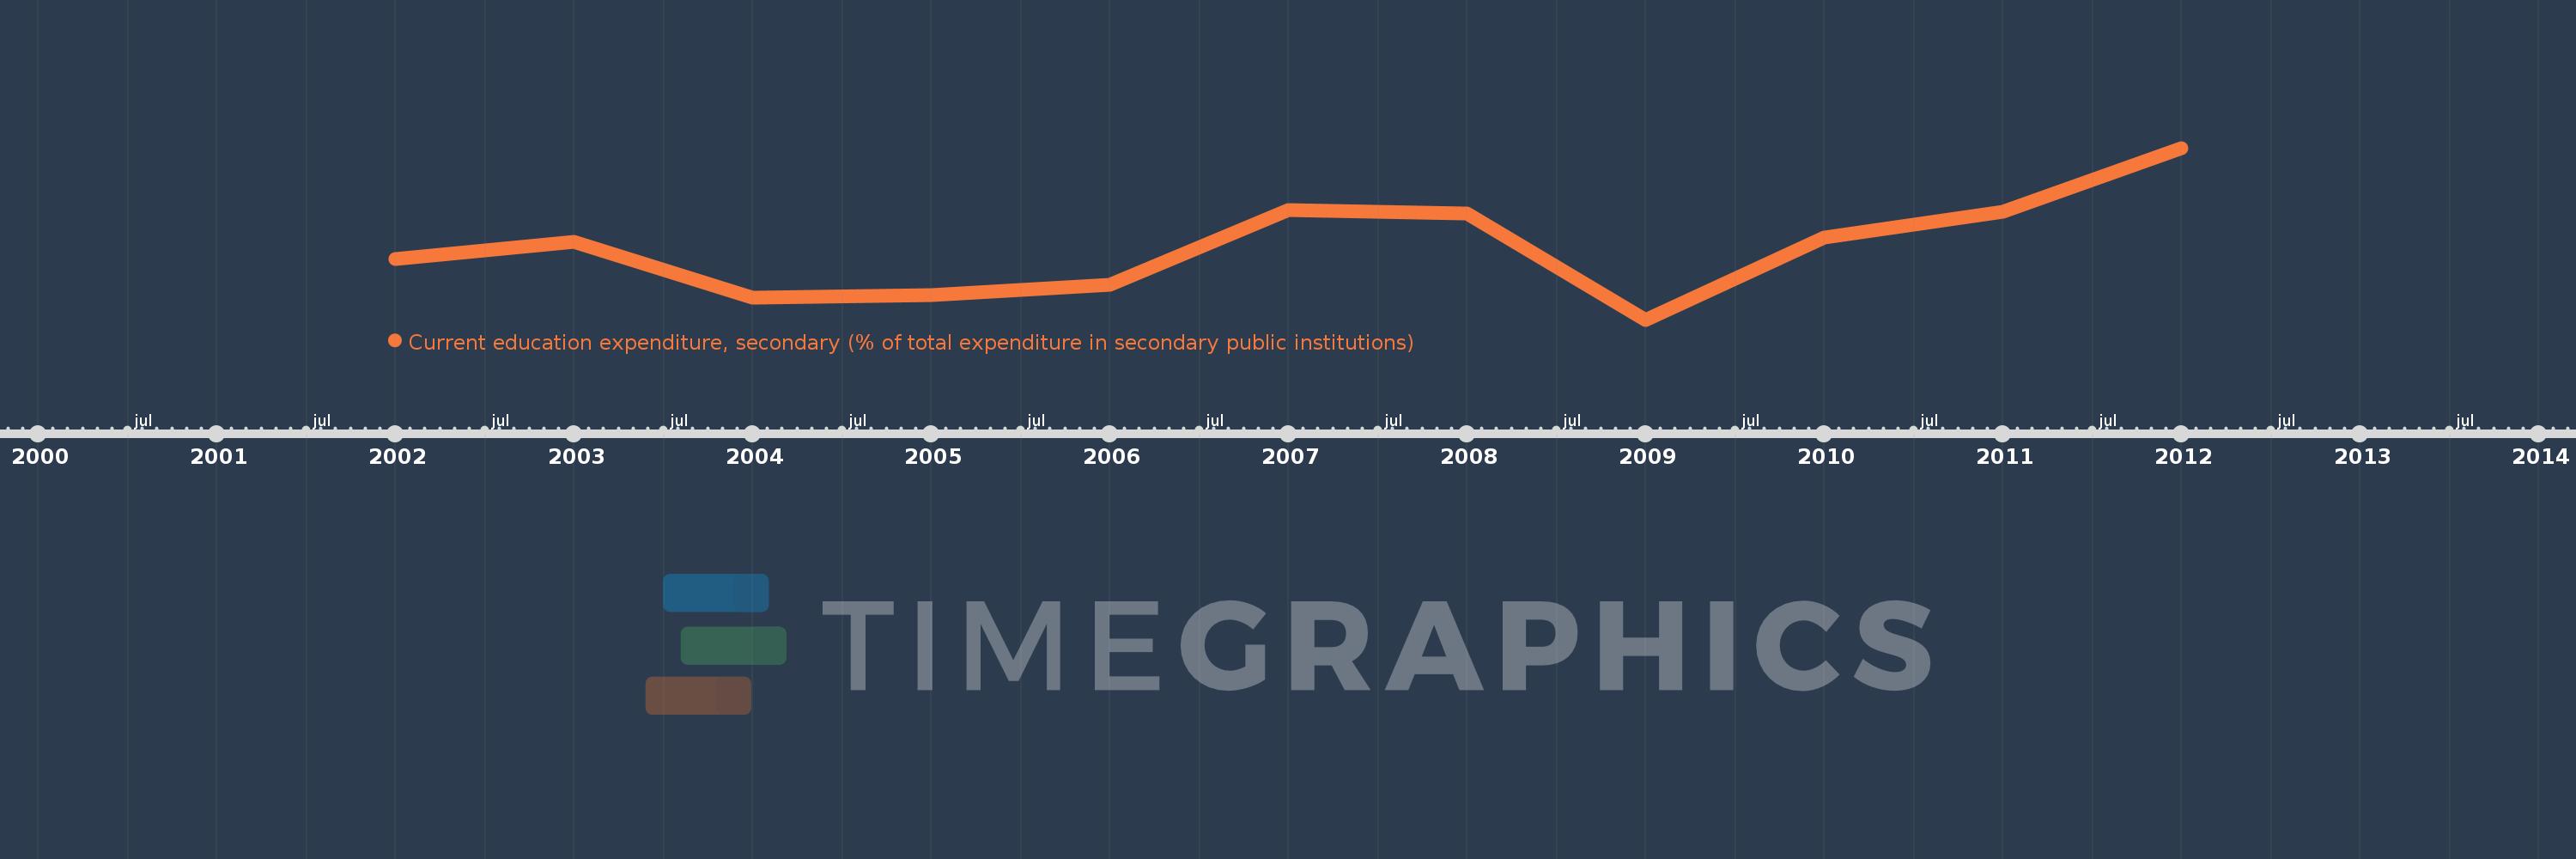
Current education expenditure, secondary (% of total expenditure in secondary public institutions)
2012,2011,2010,2009,2008,2007,2006,2005,2004,2003,2002
This statistics in other country:
Timeline:
This timeline shows a graph from 2002 to 2012 of Luxembourg. No data until 2001. Number of actual observations by date: 11.
Source name:
World Development Indicators
Source organization:
United Nations Educational, Scientific, and Cultural Organization (UNESCO) Institute for Statistics.
Categories, topics:
Education
Last updated:
apr 23, 2017
Indicators value changes by year
Maximum:
90.295
jan 1, 2012
At the date of observation
Value
Absolute change
Change from previous value
jan 1, 2002
84.415
+84.415
0.0%
jan 1, 2003
85.292
+0.877
1.04%
jan 1, 2004
82.335
-2.957
-3.47%
jan 1, 2005
82.499
+0.164
0.2%
jan 1, 2006
83.028
+0.529
0.64%
jan 1, 2007
87.013
+3.985
4.8%
jan 1, 2008
86.828
-0.186
-0.21%
jan 1, 2009
81.17
-5.658
-6.52%
jan 1, 2010
85.533
+4.363
5.38%
jan 1, 2011
86.894
+1.361
1.59%
jan 1, 2012
90.295
+3.401
3.91%
Ranking of countries by current statistics by years


Comments: