29
/
en
AIzaSyAYiBZKx7MnpbEhh9jyipgxe19OcubqV5w
April 1, 2024
121942
Dominican Republic
DOM
true
2
1
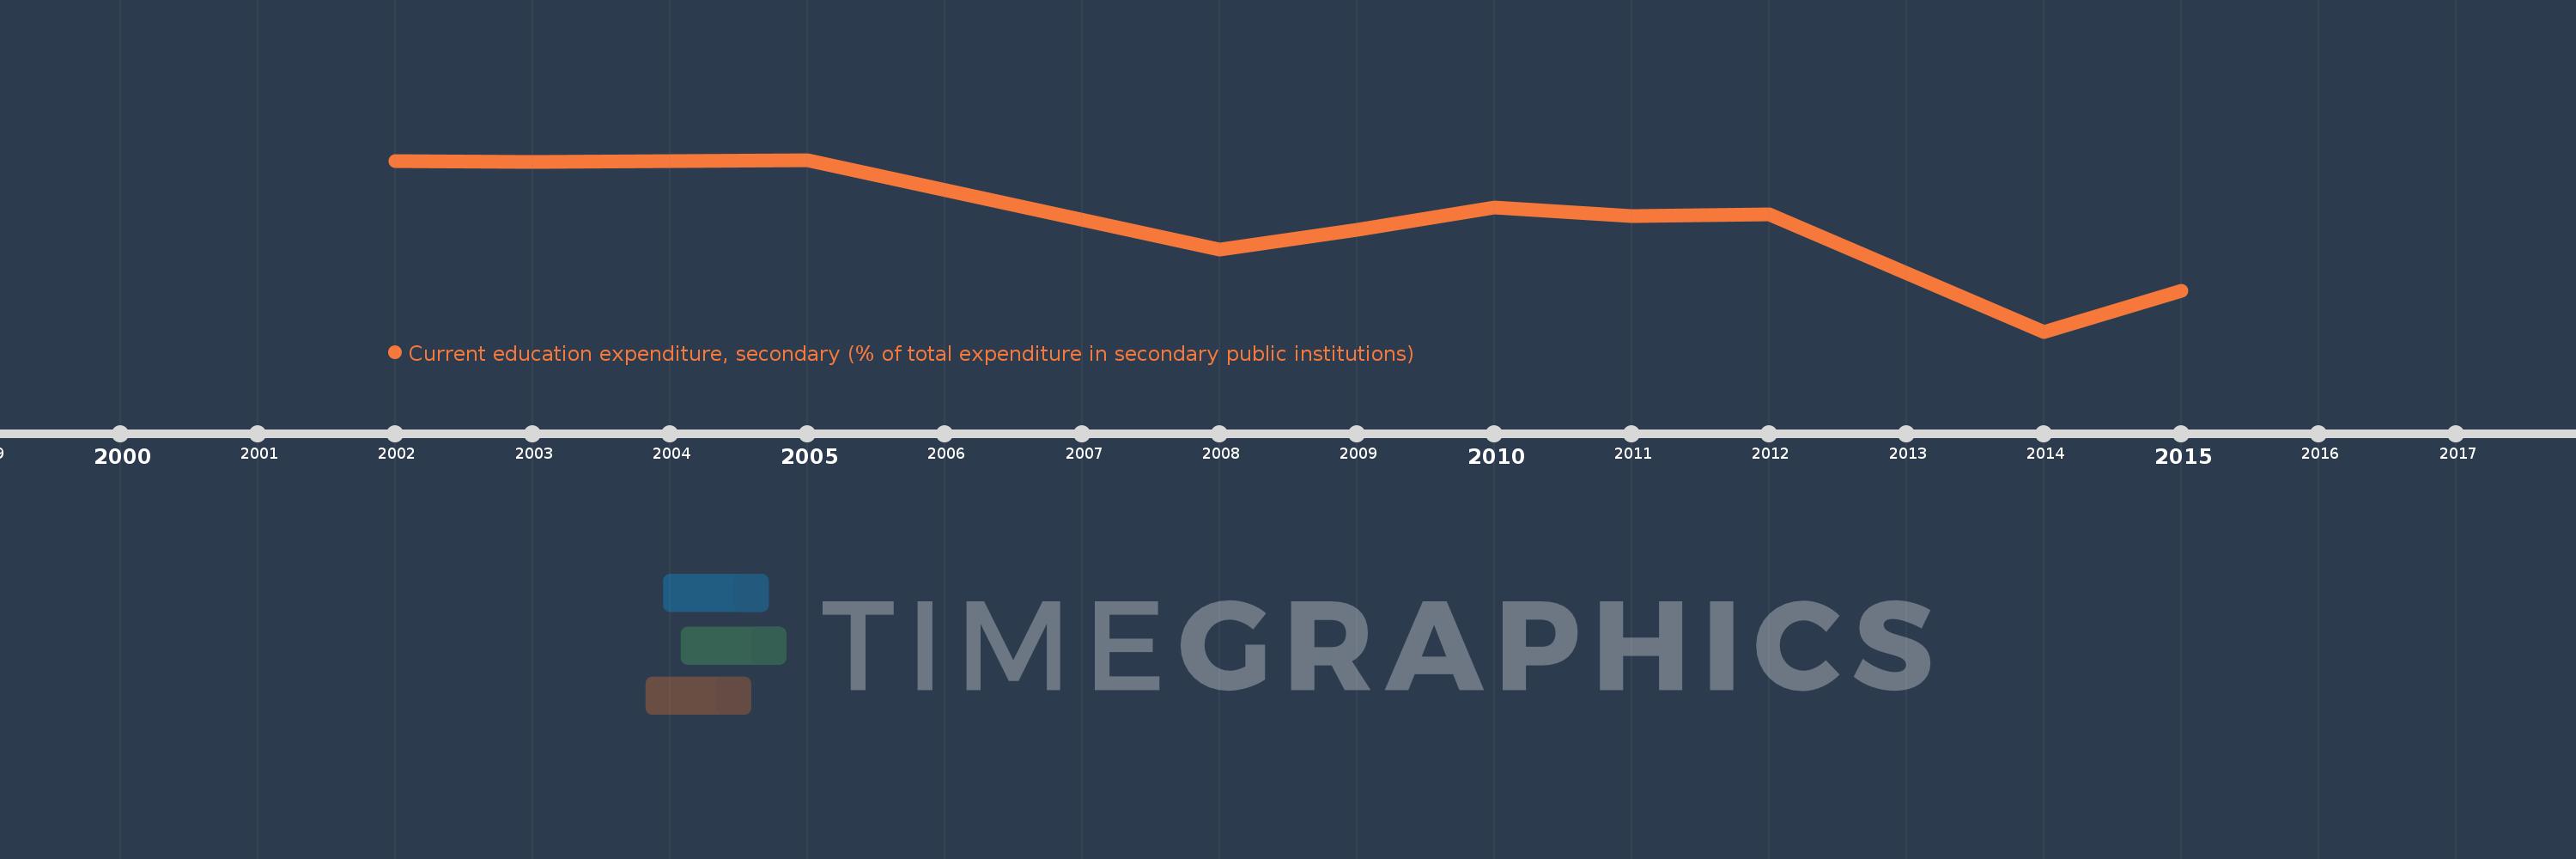
Current education expenditure, secondary (% of total expenditure in secondary public institutions)
2015,2014,2012,2011,2010,2009,2008,2005,2003,2002
This statistics in other country:
Timeline:
This timeline shows a graph from 2002 to 2015 of Dominican Republic. No data until 2001. Number of actual observations by date: 10.
Source name:
World Development Indicators
Source organization:
United Nations Educational, Scientific, and Cultural Organization (UNESCO) Institute for Statistics.
Categories, topics:
Education
Last updated:
apr 23, 2017
Indicators value changes by year
Minimum:
60.886
jan 1, 2014
Maximum:
99.677
jan 1, 2005
At the date of observation
Value
Absolute change
Change from previous value
jan 1, 2002
99.402
+99.402
0.0%
jan 1, 2003
99.211
-0.192
-0.19%
jan 1, 2005
99.677
+0.466
0.47%
jan 1, 2008
79.316
-20.361
-20.43%
jan 1, 2009
83.773
+4.457
5.62%
jan 1, 2010
88.983
+5.209
6.22%
jan 1, 2011
86.93
-2.053
-2.31%
jan 1, 2012
87.328
+0.398
0.46%
jan 1, 2014
60.886
-26.442
-30.28%
jan 1, 2015
70.019
+9.133
15.0%
Ranking of countries by current statistics by years


Comments: