29
/
en
AIzaSyAYiBZKx7MnpbEhh9jyipgxe19OcubqV5w
April 1, 2024
195361
Mexico
MEX
true
2
1
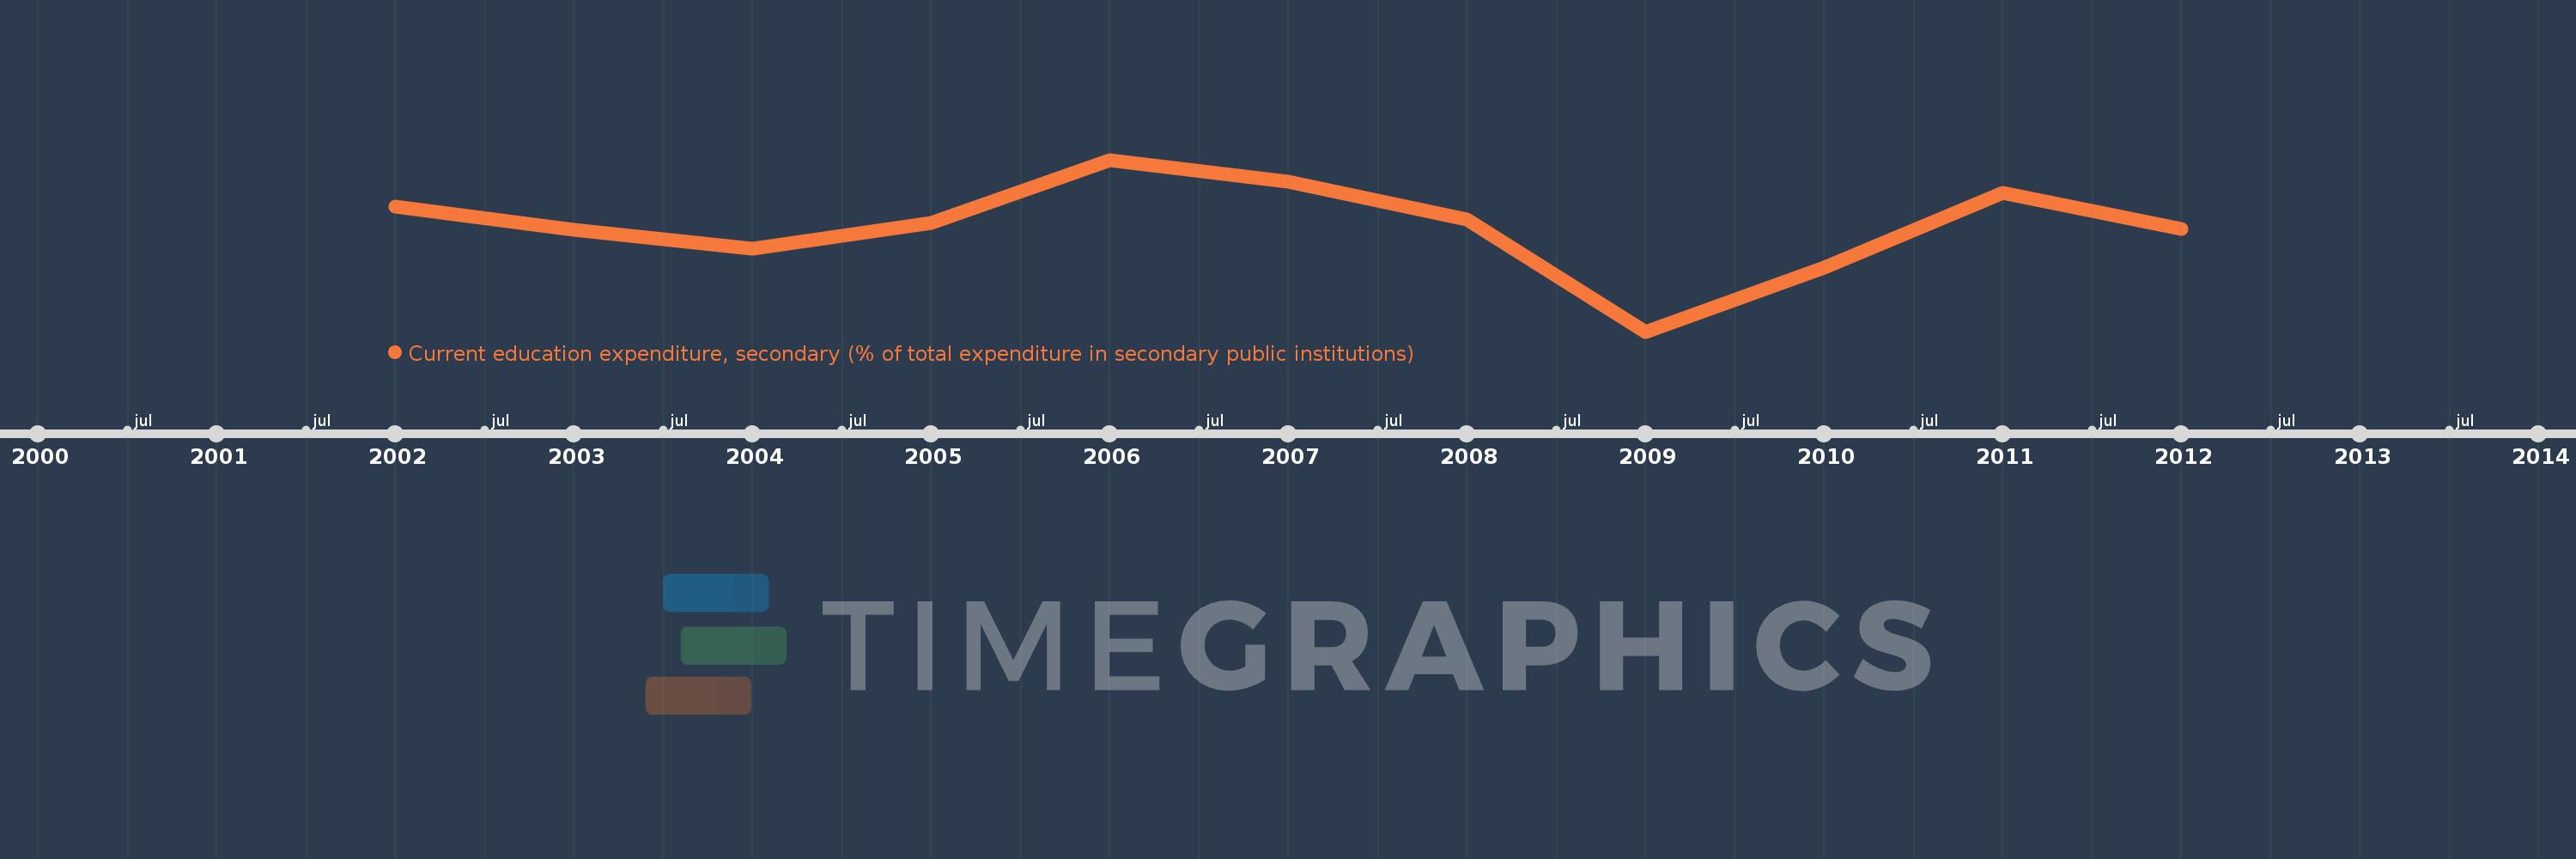
Current education expenditure, secondary (% of total expenditure in secondary public institutions)
2012,2011,2010,2009,2008,2007,2006,2005,2004,2003,2002
This statistics in other country:
Timeline:
This timeline shows a graph from 2002 to 2012 of Mexico. No data until 2001. Number of actual observations by date: 11.
Source name:
World Development Indicators
Source organization:
United Nations Educational, Scientific, and Cultural Organization (UNESCO) Institute for Statistics.
Categories, topics:
Education
Last updated:
apr 23, 2017
Indicators value changes by year
Minimum:
95.871
jan 1, 2009
Maximum:
97.345
jan 1, 2006
At the date of observation
Value
Absolute change
Change from previous value
jan 1, 2002
96.943
+96.943
0.0%
jan 1, 2003
96.744
-0.199
-0.21%
jan 1, 2004
96.583
-0.162
-0.17%
jan 1, 2005
96.803
+0.22
0.23%
jan 1, 2006
97.345
+0.542
0.56%
jan 1, 2007
97.157
-0.187
-0.19%
jan 1, 2008
96.835
-0.322
-0.33%
jan 1, 2009
95.871
-0.965
-1.0%
jan 1, 2010
96.419
+0.549
0.57%
jan 1, 2011
97.061
+0.642
0.67%
jan 1, 2012
96.754
-0.307
-0.32%
Ranking of countries by current statistics by years


Comments: