29
/
en
AIzaSyAYiBZKx7MnpbEhh9jyipgxe19OcubqV5w
April 1, 2024
54673
Post-demographic dividend
PST
false
2
1
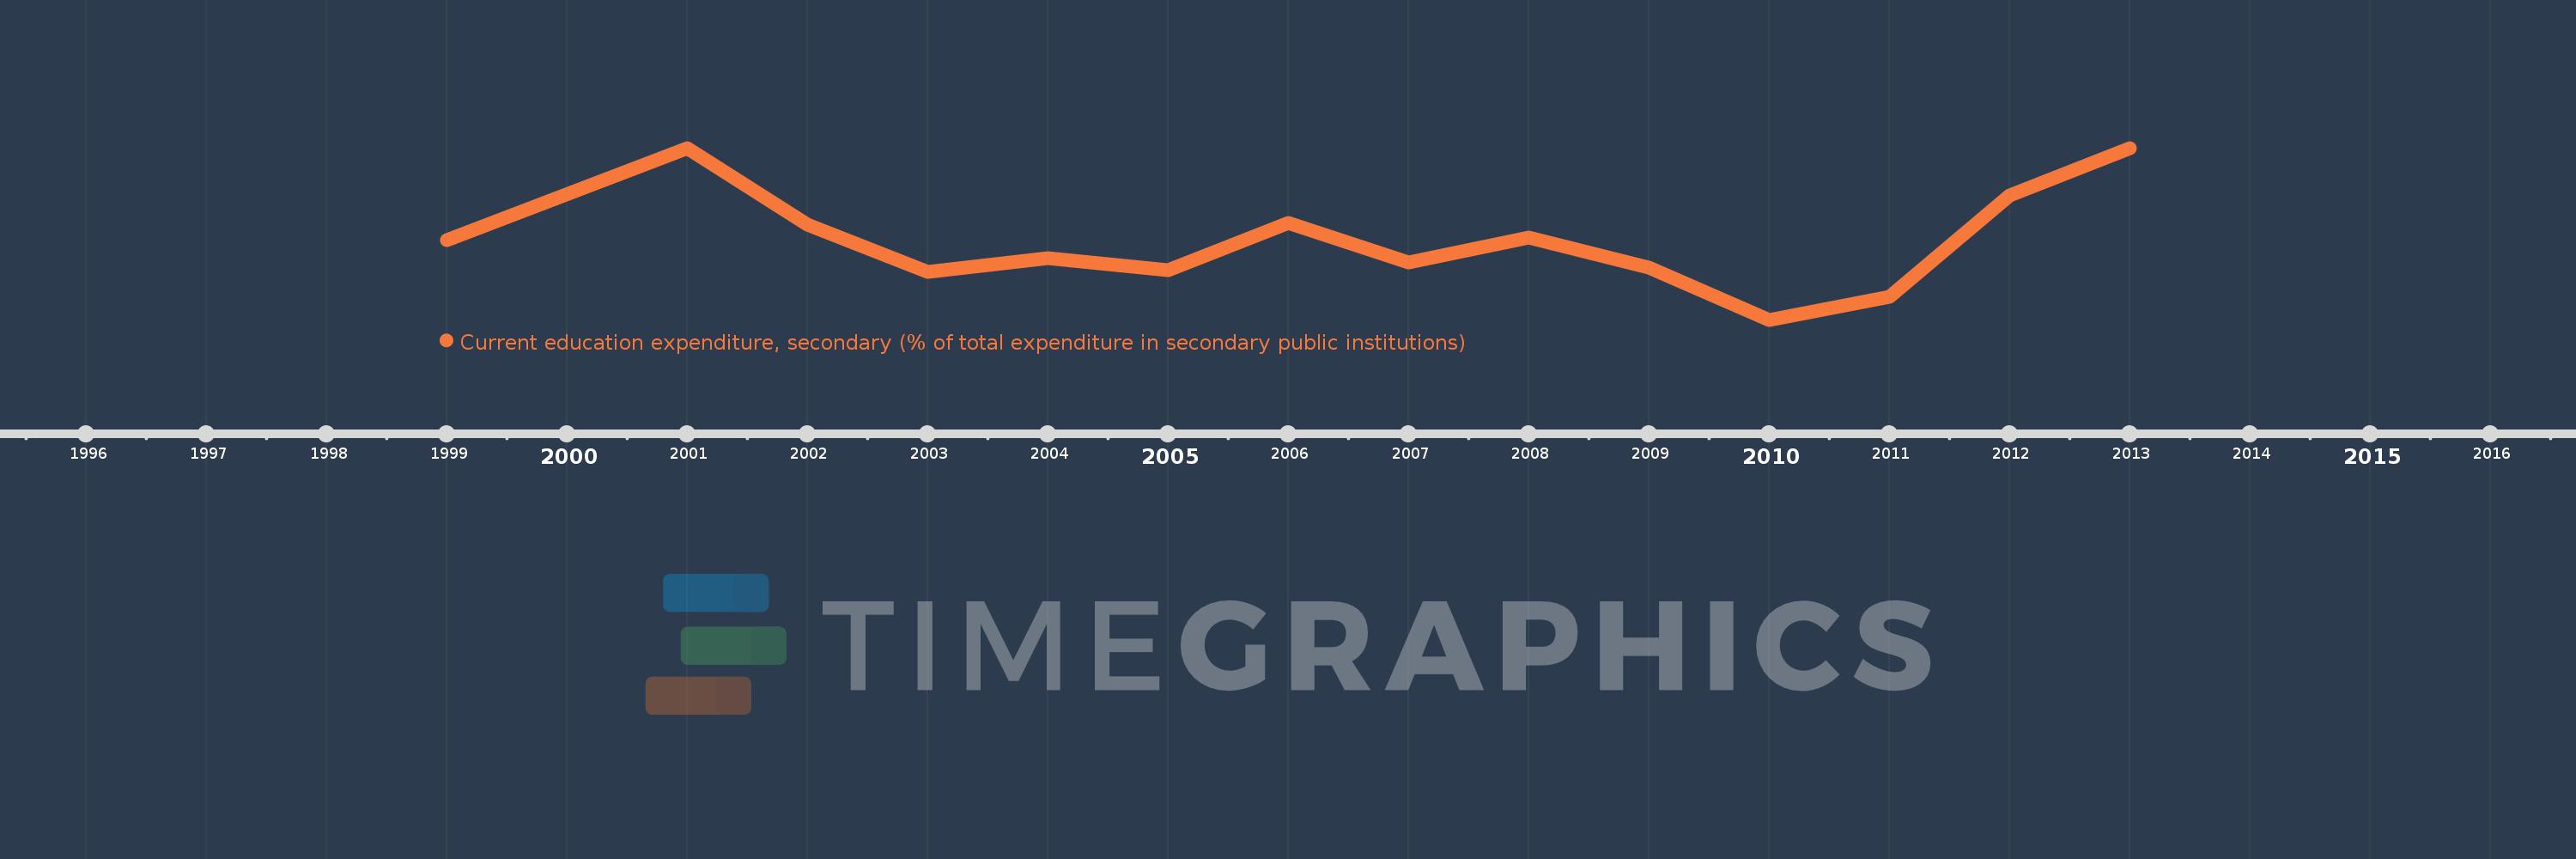
Current education expenditure, secondary (% of total expenditure in secondary public institutions)
2013,2012,2011,2010,2009,2008,2007,2006,2005,2004,2003,2002,2001,1999
This statistics in other country:
Timeline:
This timeline shows a graph from 1999 to 2013 of Post-demographic dividend. No data until 1998. Number of actual observations by date: 14.
Source name:
World Development Indicators
Source organization:
United Nations Educational, Scientific, and Cultural Organization (UNESCO) Institute for Statistics.
Categories, topics:
Education
Last updated:
apr 23, 2017
Indicators value changes by year
Minimum:
91.479
jan 1, 2010
Maximum:
93.111
jan 1, 2013
At the date of observation
Value
Absolute change
Change from previous value
jan 1, 1999
92.239
+92.239
0.0%
jan 1, 2001
93.111
+0.872
0.95%
jan 1, 2002
92.383
-0.728
-0.78%
jan 1, 2003
91.936
-0.447
-0.48%
jan 1, 2004
92.064
+0.128
0.14%
jan 1, 2005
91.947
-0.116
-0.13%
jan 1, 2006
92.395
+0.448
0.49%
jan 1, 2007
92.023
-0.372
-0.4%
jan 1, 2008
92.258
+0.235
0.26%
jan 1, 2009
91.975
-0.282
-0.31%
jan 1, 2010
91.479
-0.496
-0.54%
jan 1, 2011
91.694
+0.214
0.23%
jan 1, 2012
92.66
+0.967
1.05%
jan 1, 2013
93.111
+0.451
0.49%
Ranking of countries by current statistics by years


Comments: