29
/
en
AIzaSyAYiBZKx7MnpbEhh9jyipgxe19OcubqV5w
April 1, 2024
132994
Finland
FIN
true
2
1
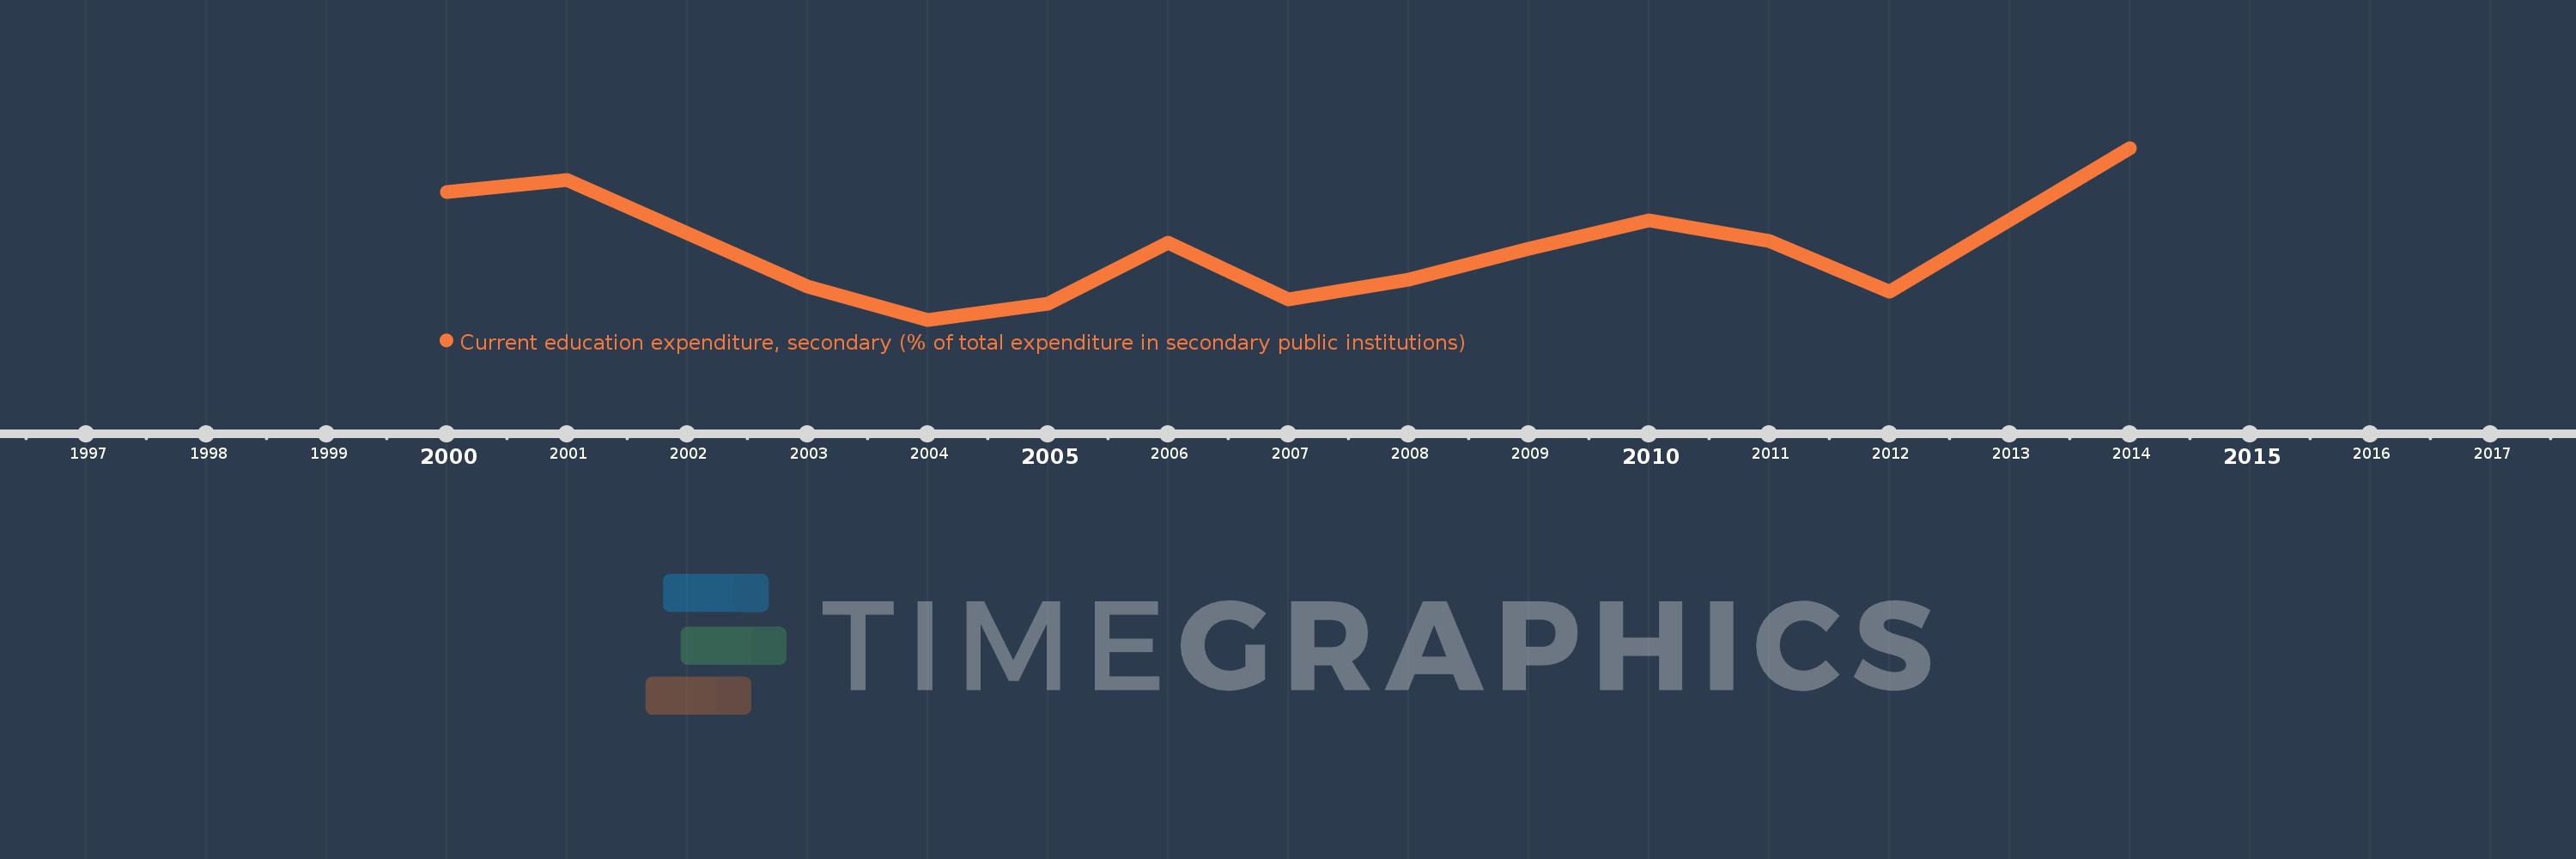
Current education expenditure, secondary (% of total expenditure in secondary public institutions)
2014,2012,2011,2010,2009,2008,2007,2006,2005,2004,2003,2002,2001,2000
This statistics in other country:
Timeline:
This timeline shows a graph from 2000 to 2014 of Finland. No data until 1999. Number of actual observations by date: 14.
Source name:
World Development Indicators
Source organization:
United Nations Educational, Scientific, and Cultural Organization (UNESCO) Institute for Statistics.
Categories, topics:
Education
Last updated:
apr 23, 2017
Indicators value changes by year
Minimum:
89.866
jan 1, 2004
Maximum:
93.861
jan 1, 2014
At the date of observation
Value
Absolute change
Change from previous value
jan 1, 2000
92.836
+92.836
0.0%
jan 1, 2001
93.111
+0.275
0.3%
jan 1, 2002
91.884
-1.227
-1.32%
jan 1, 2003
90.644
-1.24
-1.35%
jan 1, 2004
89.866
-0.777
-0.86%
jan 1, 2005
90.244
+0.377
0.42%
jan 1, 2006
91.658
+1.414
1.57%
jan 1, 2007
90.337
-1.321
-1.44%
jan 1, 2008
90.79
+0.453
0.5%
jan 1, 2009
91.514
+0.725
0.8%
jan 1, 2010
92.173
+0.659
0.72%
jan 1, 2011
91.694
-0.479
-0.52%
jan 1, 2012
90.513
-1.181
-1.29%
jan 1, 2014
93.861
+3.348
3.7%
Ranking of countries by current statistics by years


Comments: