29
/
en
AIzaSyAYiBZKx7MnpbEhh9jyipgxe19OcubqV5w
April 1, 2024
145523
Guinea
GIN
true
2
1
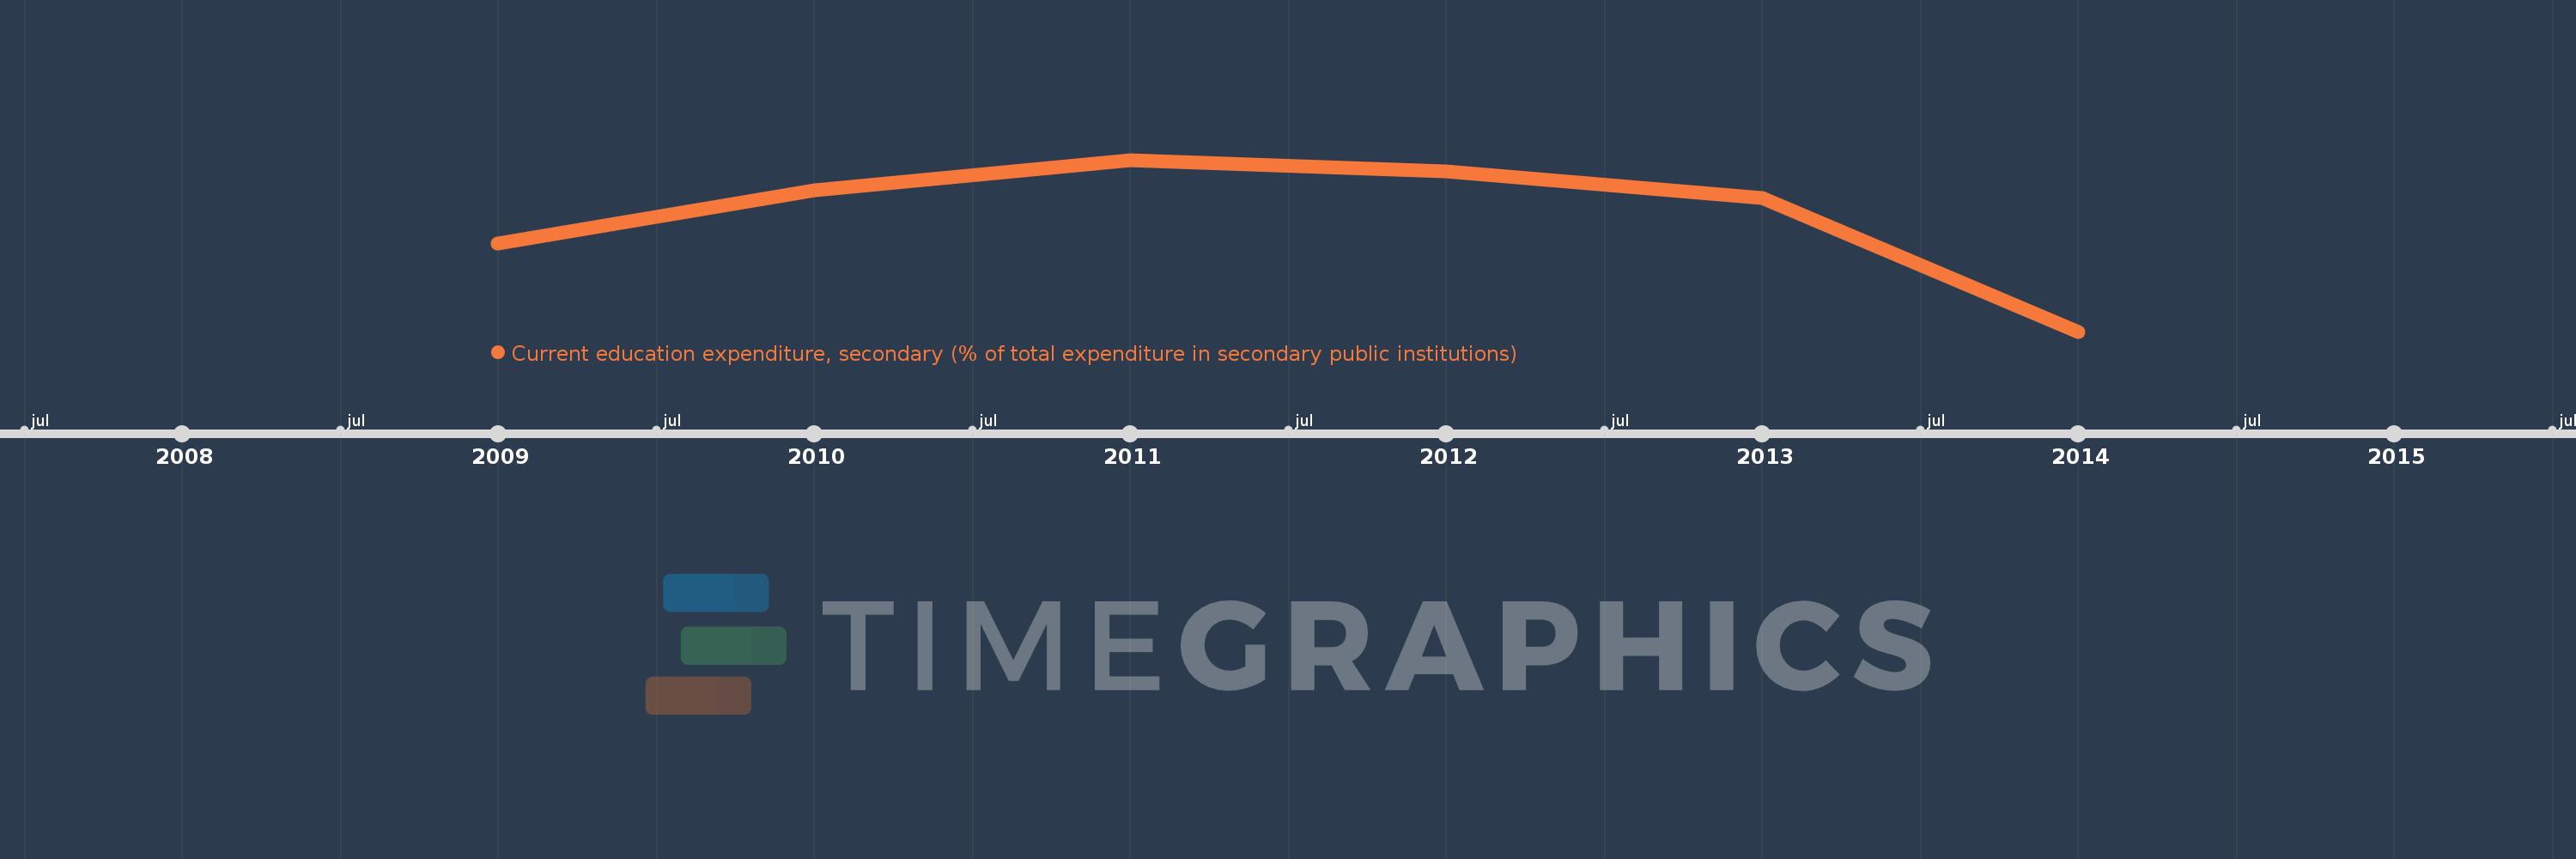
Current education expenditure, secondary (% of total expenditure in secondary public institutions)
2014,2013,2012,2011,2010,2009
This statistics in other country:
Timeline:
This timeline shows a graph from 2009 to 2014 of Guinea. No data until 2008. Number of actual observations by date: 6.
Source name:
World Development Indicators
Source organization:
United Nations Educational, Scientific, and Cultural Organization (UNESCO) Institute for Statistics.
Categories, topics:
Education
Last updated:
apr 23, 2017
Indicators value changes by year
Minimum:
81.042
jan 1, 2014
Maximum:
98.357
jan 1, 2011
At the date of observation
Value
Absolute change
Change from previous value
jan 1, 2009
89.938
+89.938
0.0%
jan 1, 2010
95.257
+5.319
5.91%
jan 1, 2011
98.357
+3.1
3.25%
jan 1, 2012
97.157
-1.2
-1.22%
jan 1, 2013
94.473
-2.685
-2.76%
jan 1, 2014
81.042
-13.431
-14.22%
Ranking of countries by current statistics by years


Comments: