29
/
en
AIzaSyAYiBZKx7MnpbEhh9jyipgxe19OcubqV5w
April 1, 2024
233507
Sao Tome and Principe
STP
true
2
1
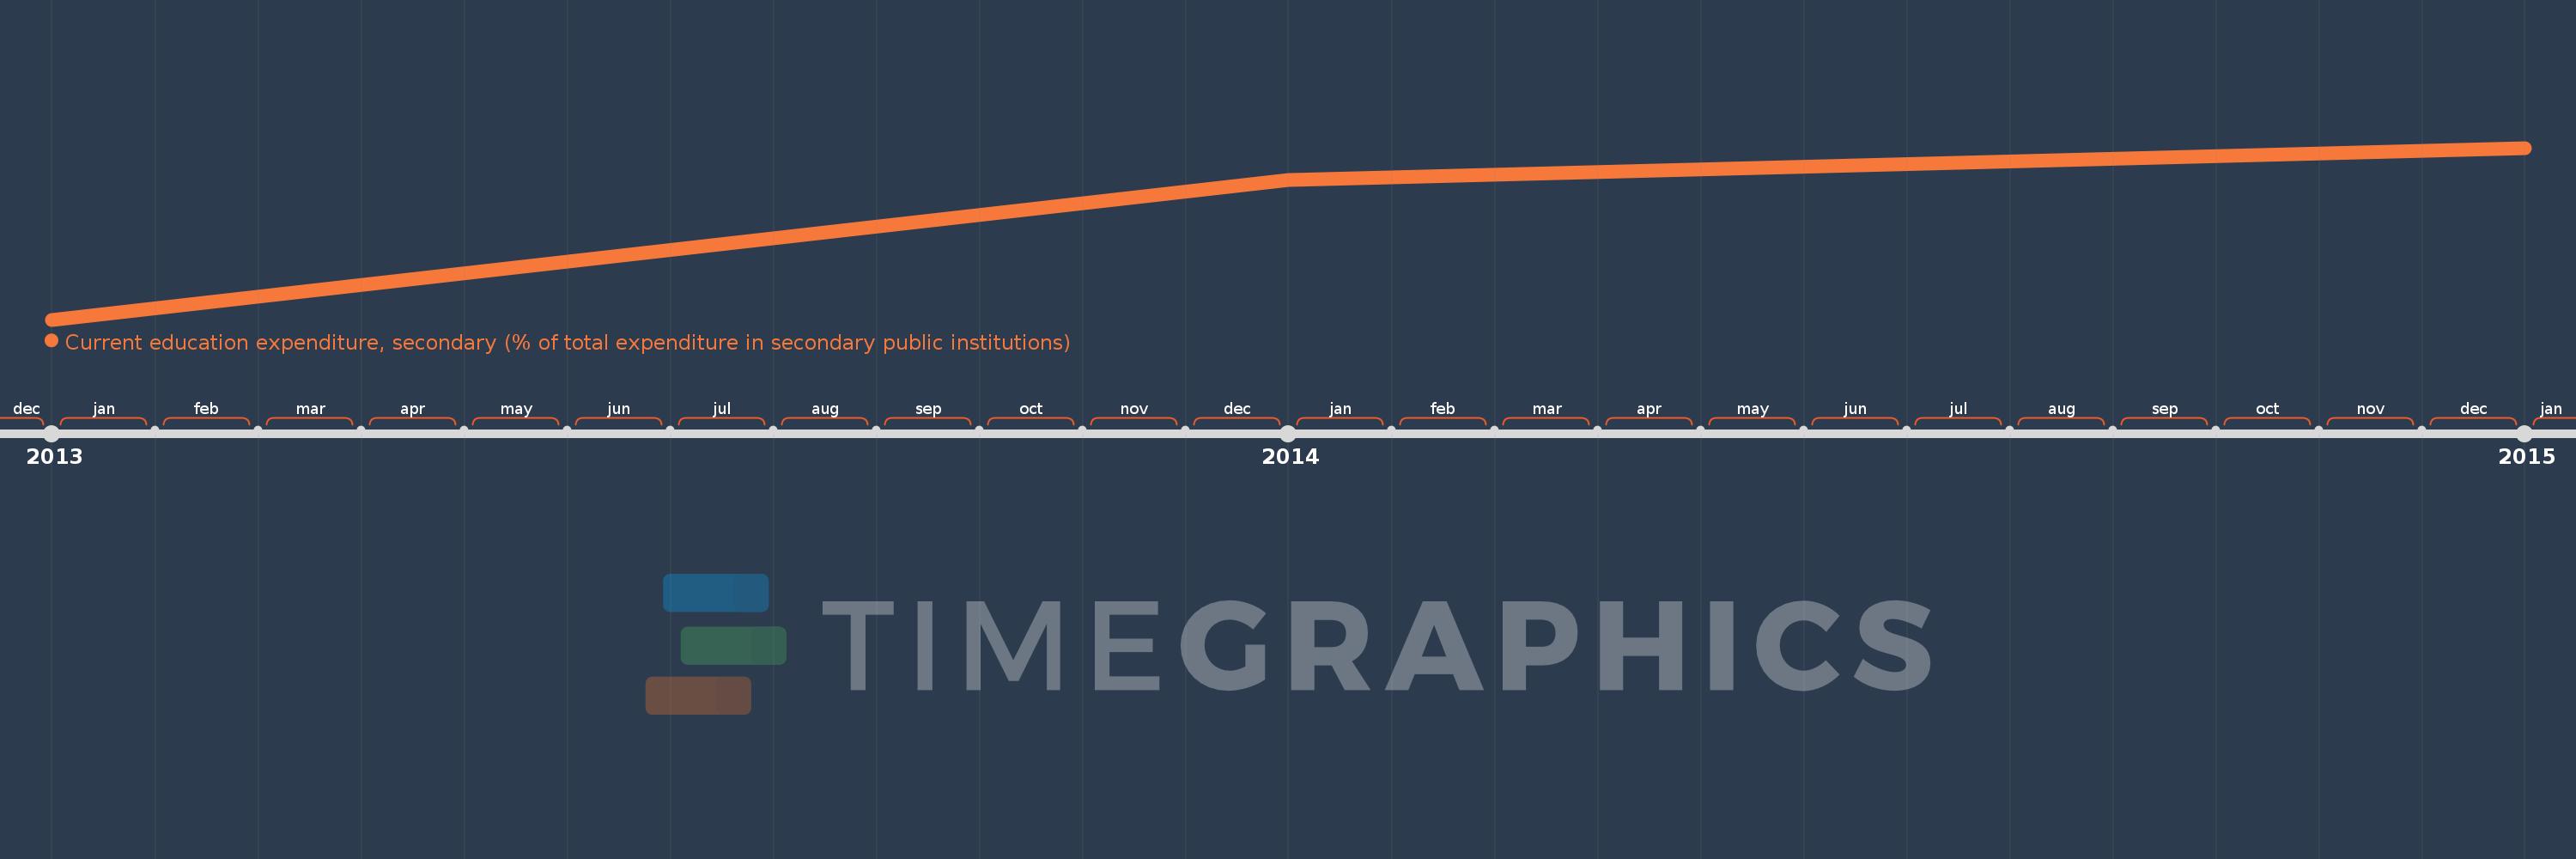
Current education expenditure, secondary (% of total expenditure in secondary public institutions)
2015,2014,2013
This statistics in other country:
Timeline:
This timeline shows a graph from 2013 to 2015 of Sao Tome and Principe. No data until 2012. Number of actual observations by date: 3.
Source name:
World Development Indicators
Source organization:
United Nations Educational, Scientific, and Cultural Organization (UNESCO) Institute for Statistics.
Categories, topics:
Education
Last updated:
apr 23, 2017
Indicators value changes by year
Minimum:
49.012
jan 1, 2013
Maximum:
90.145
jan 1, 2015
At the date of observation
Value
Absolute change
Change from previous value
jan 1, 2013
49.012
+49.012
0.0%
jan 1, 2014
82.405
+33.393
68.13%
jan 1, 2015
90.145
+7.74
9.39%
Ranking of countries by current statistics by years


Comments: