29
/
en
AIzaSyAYiBZKx7MnpbEhh9jyipgxe19OcubqV5w
April 1, 2024
185019
Madagascar
MDG
true
2
1
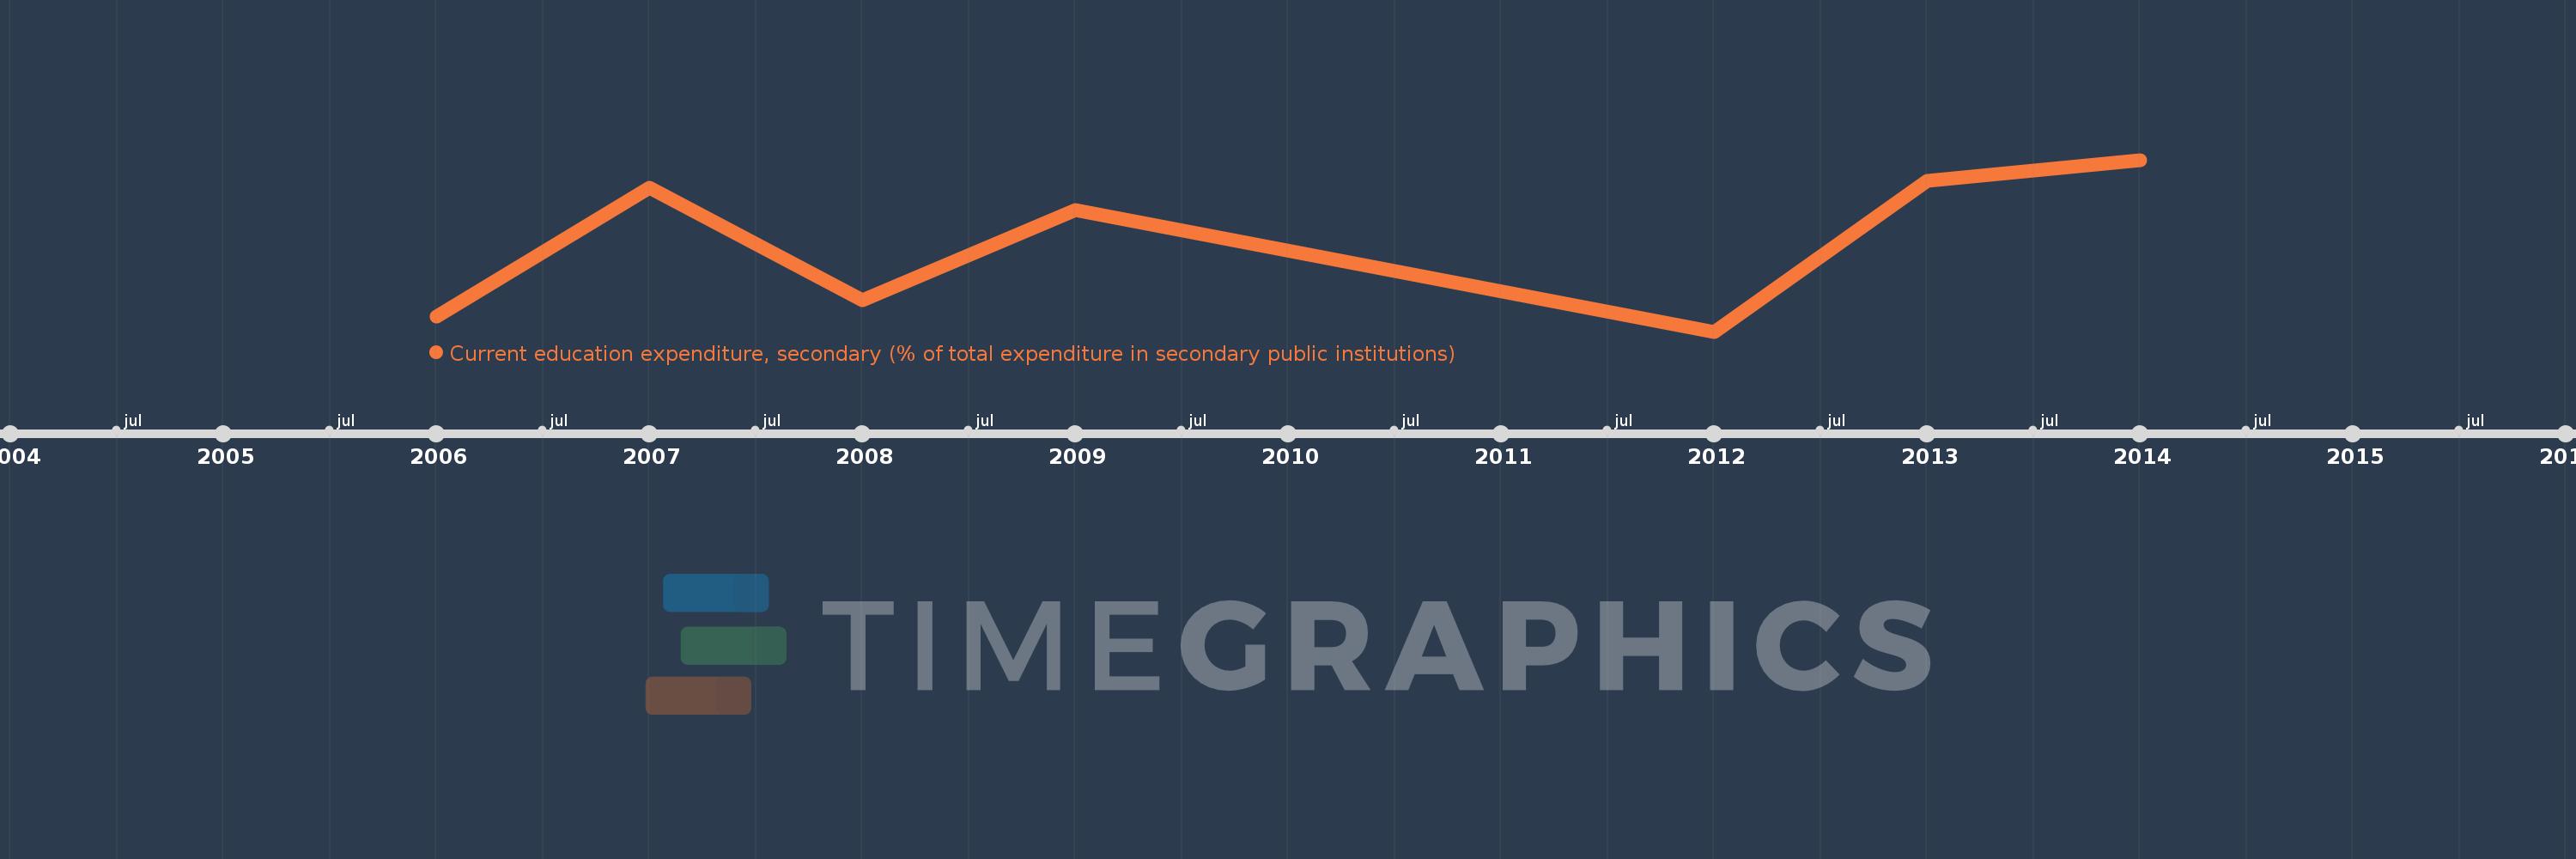
Current education expenditure, secondary (% of total expenditure in secondary public institutions)
2014,2013,2012,2009,2008,2007,2006
This statistics in other country:
Timeline:
This timeline shows a graph from 2006 to 2014 of Madagascar. No data until 2005. Number of actual observations by date: 7.
Source name:
World Development Indicators
Source organization:
United Nations Educational, Scientific, and Cultural Organization (UNESCO) Institute for Statistics.
Categories, topics:
Education
Last updated:
apr 23, 2017
Indicators value changes by year
Minimum:
86.946
jan 1, 2012
Maximum:
98.137
jan 1, 2014
At the date of observation
Value
Absolute change
Change from previous value
jan 1, 2006
87.918
+87.918
0.0%
jan 1, 2007
96.325
+8.407
9.56%
jan 1, 2008
89.015
-7.31
-7.59%
jan 1, 2009
94.855
+5.84
6.56%
jan 1, 2012
86.946
-7.91
-8.34%
jan 1, 2013
96.748
+9.803
11.27%
jan 1, 2014
98.137
+1.389
1.44%
Ranking of countries by current statistics by years


Comments: