29
/
en
AIzaSyAYiBZKx7MnpbEhh9jyipgxe19OcubqV5w
April 1, 2024
104706
Chile
CHL
true
2
1
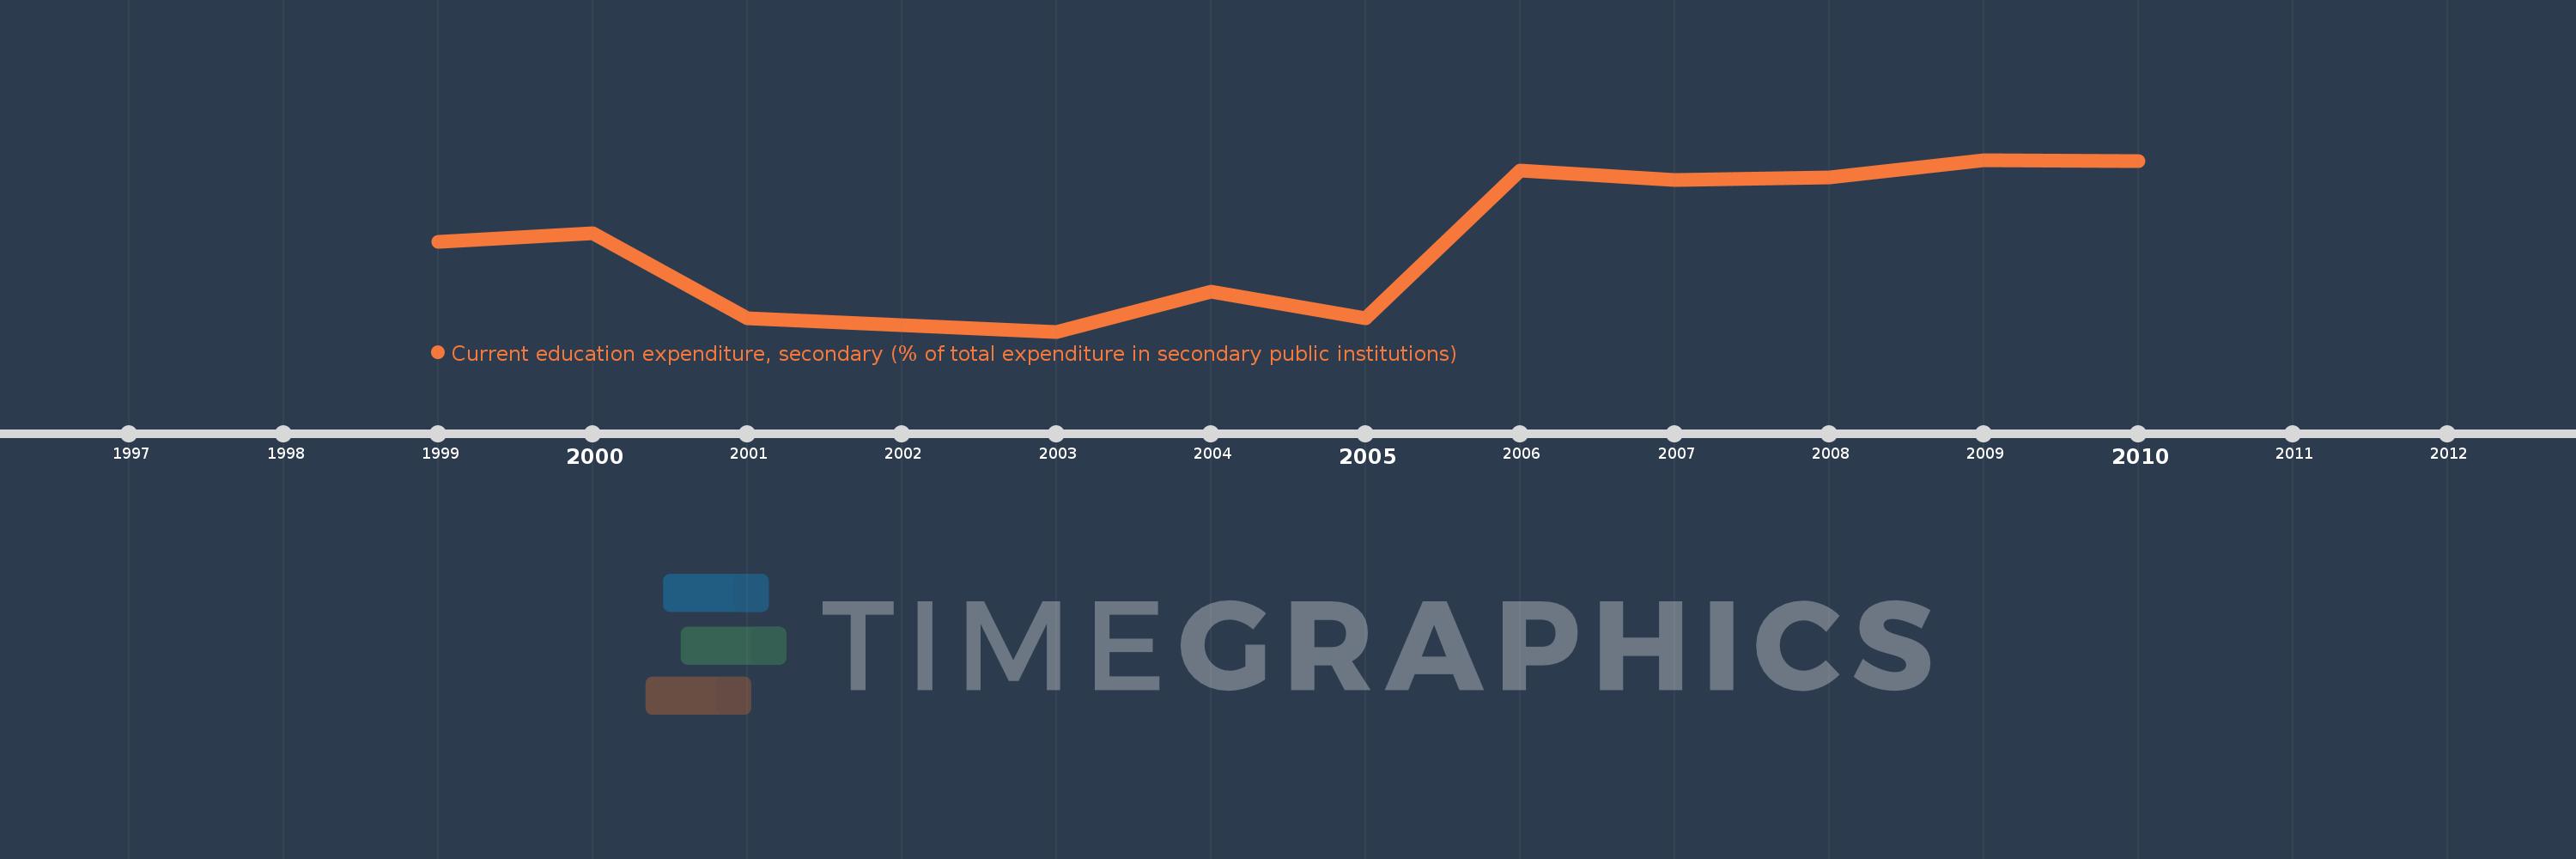
Current education expenditure, secondary (% of total expenditure in secondary public institutions)
2010,2009,2008,2007,2006,2005,2004,2003,2001,2000,1999
This statistics in other country:
Timeline:
This timeline shows a graph from 1999 to 2010 of Chile. No data until 1998. Number of actual observations by date: 11.
Source name:
World Development Indicators
Source organization:
United Nations Educational, Scientific, and Cultural Organization (UNESCO) Institute for Statistics.
Categories, topics:
Education
Last updated:
apr 23, 2017
Indicators value changes by year
Minimum:
83.601
jan 1, 2003
Maximum:
97.763
jan 1, 2009
At the date of observation
Value
Absolute change
Change from previous value
jan 1, 1999
90.997
+90.997
0.0%
jan 1, 2000
91.733
+0.736
0.81%
jan 1, 2001
84.674
-7.059
-7.7%
jan 1, 2003
83.601
-1.073
-1.27%
jan 1, 2004
86.869
+3.268
3.91%
jan 1, 2005
84.695
-2.175
-2.5%
jan 1, 2006
96.901
+12.207
14.41%
jan 1, 2007
96.066
-0.836
-0.86%
jan 1, 2008
96.306
+0.24
0.25%
jan 1, 2009
97.763
+1.457
1.51%
jan 1, 2010
97.652
-0.112
-0.11%
Ranking of countries by current statistics by years


Comments: