29
/
en
AIzaSyAYiBZKx7MnpbEhh9jyipgxe19OcubqV5w
April 1, 2024
230872
Rwanda
RWA
true
2
1
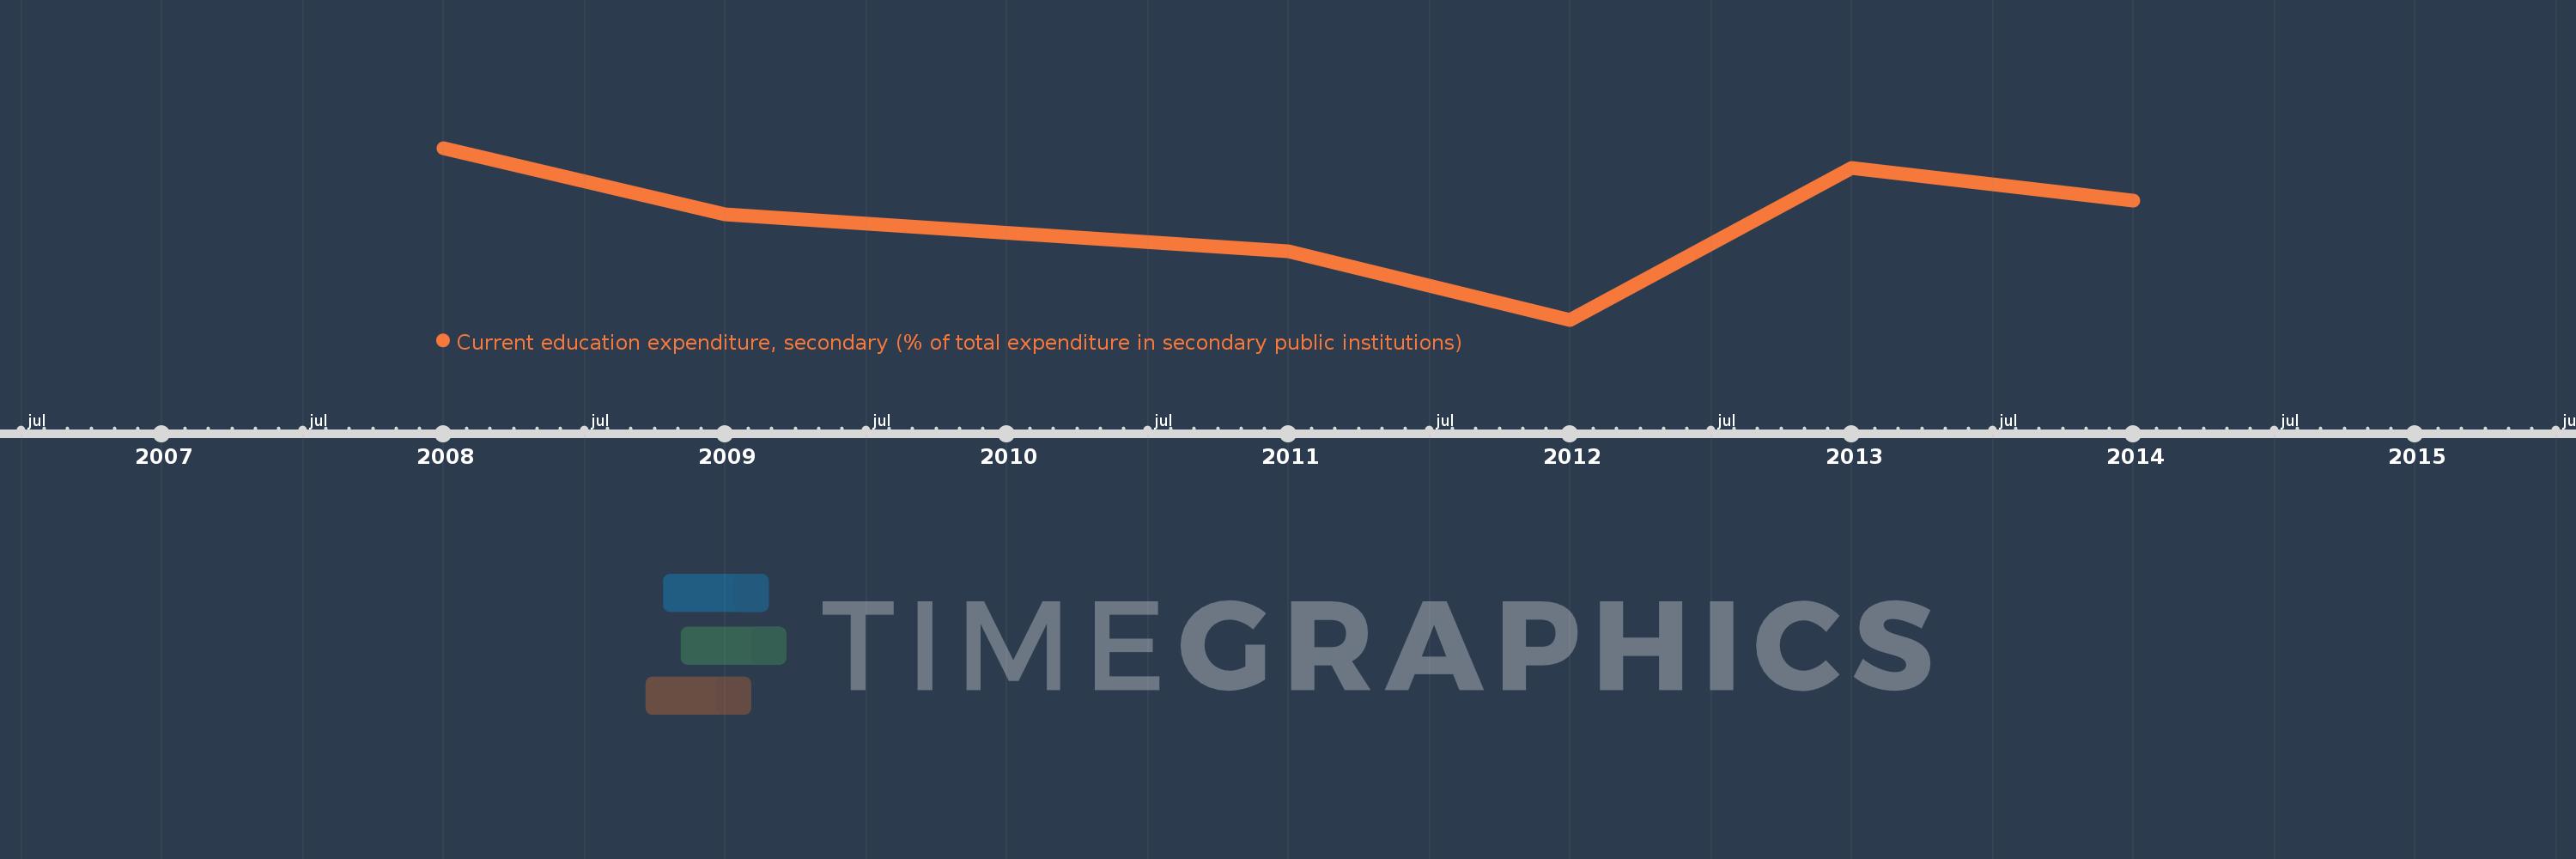
Current education expenditure, secondary (% of total expenditure in secondary public institutions)
2014,2013,2012,2011,2009,2008
This statistics in other country:
Timeline:
This timeline shows a graph from 2008 to 2014 of Rwanda. No data until 2007. Number of actual observations by date: 6.
Source name:
World Development Indicators
Source organization:
United Nations Educational, Scientific, and Cultural Organization (UNESCO) Institute for Statistics.
Categories, topics:
Education
Last updated:
apr 23, 2017
Indicators value changes by year
Minimum:
64.754
jan 1, 2012
Maximum:
94.803
jan 1, 2008
At the date of observation
Value
Absolute change
Change from previous value
jan 1, 2008
94.803
+94.803
0.0%
jan 1, 2009
83.145
-11.658
-12.3%
jan 1, 2011
76.78
-6.365
-7.66%
jan 1, 2012
64.754
-12.027
-15.66%
jan 1, 2013
91.376
+26.623
41.11%
jan 1, 2014
85.635
-5.741
-6.28%
Ranking of countries by current statistics by years


Comments: