29
/
en
AIzaSyAYiBZKx7MnpbEhh9jyipgxe19OcubqV5w
April 1, 2024
279644
Vanuatu
VUT
true
2
1
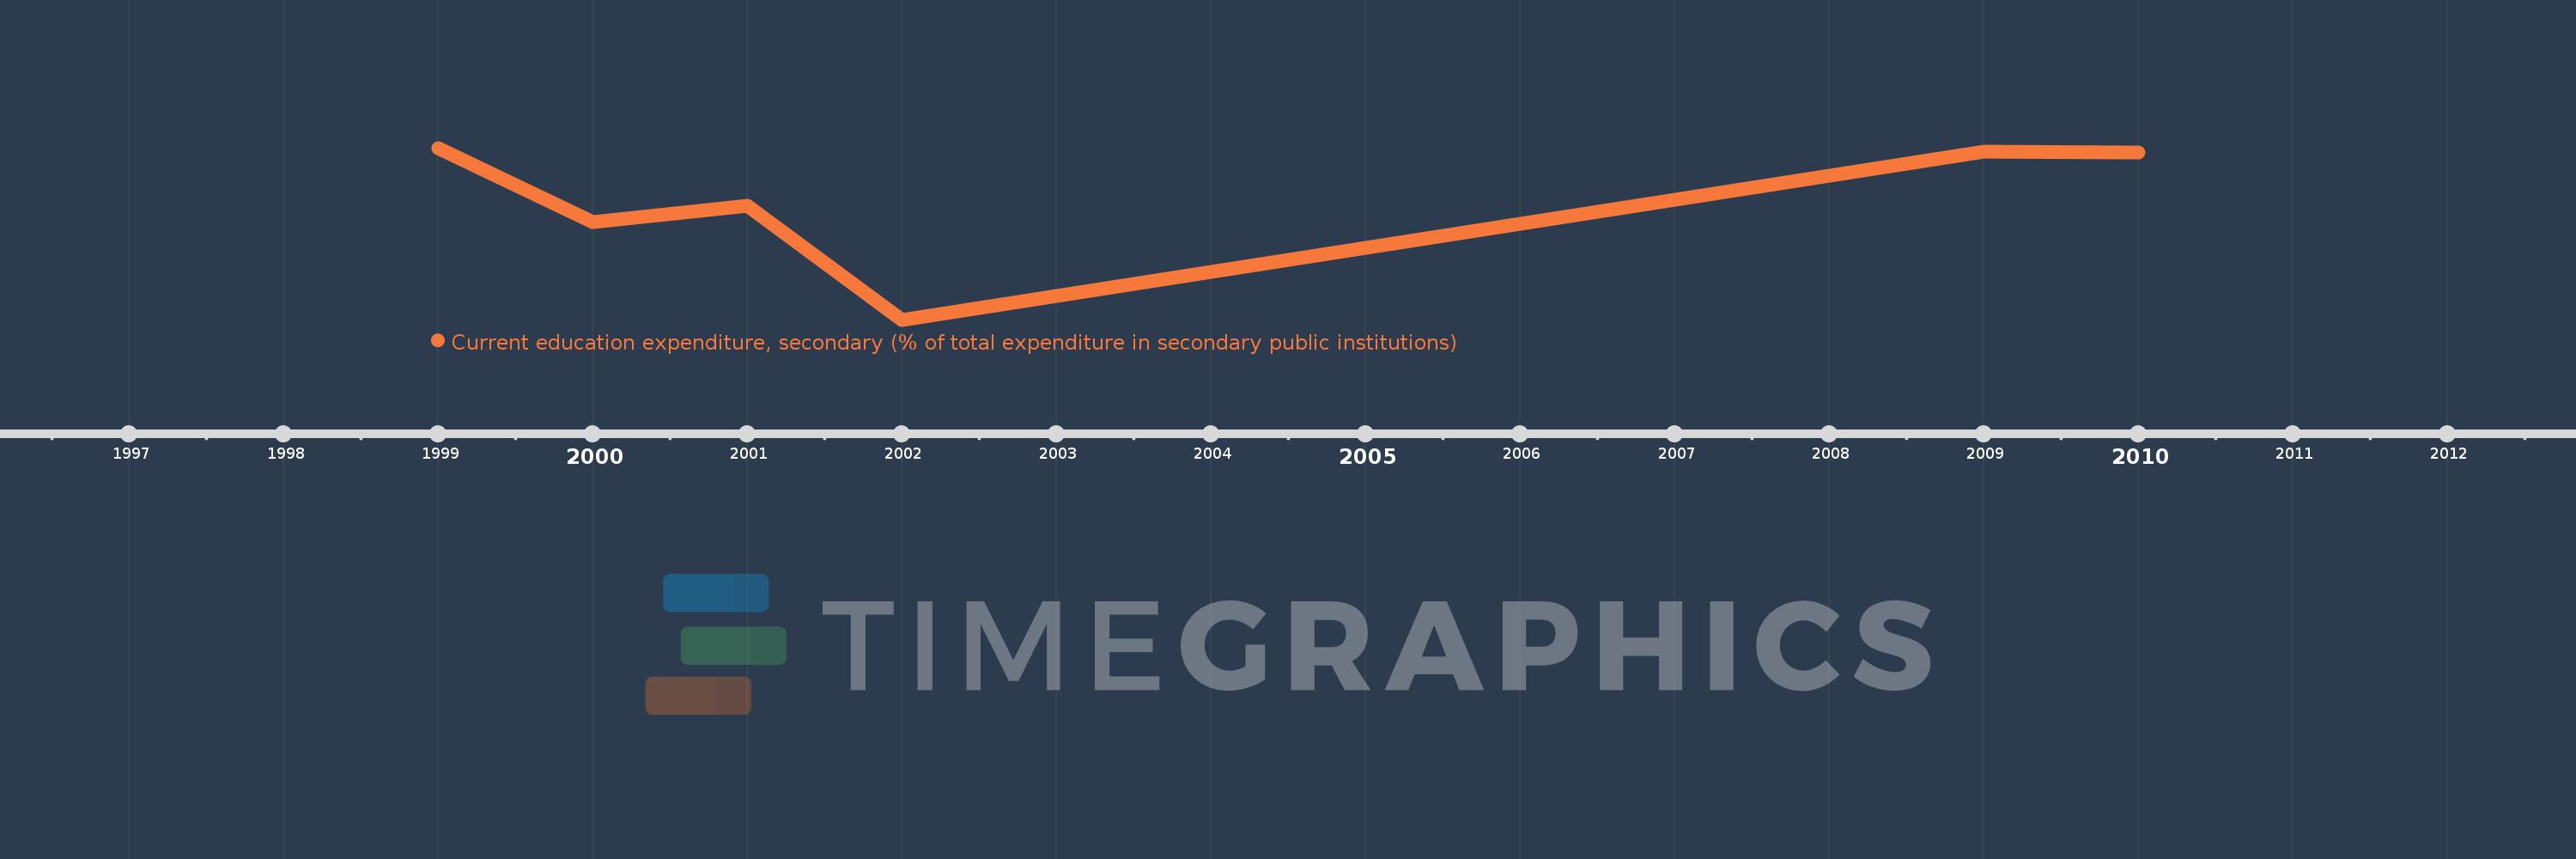
Current education expenditure, secondary (% of total expenditure in secondary public institutions)
2010,2009,2002,2001,2000,1999
This statistics in other country:
Timeline:
This timeline shows a graph from 1999 to 2010 of Vanuatu. No data until 1998. Number of actual observations by date: 6.
Source name:
World Development Indicators
Source organization:
United Nations Educational, Scientific, and Cultural Organization (UNESCO) Institute for Statistics.
Categories, topics:
Education
Last updated:
apr 23, 2017
Indicators value changes by year
Minimum:
35.833
jan 1, 2002
At the date of observation
Value
Absolute change
Change from previous value
jan 1, 1999
100.0
+100.0
0.0%
jan 1, 2000
72.207
-27.793
-27.79%
jan 1, 2001
78.29
+6.084
8.43%
jan 1, 2002
35.833
-42.457
-54.23%
jan 1, 2009
98.739
+62.906
175.55%
jan 1, 2010
98.182
-0.557
-0.56%
Ranking of countries by current statistics by years


Comments: