29
/
en
AIzaSyAYiBZKx7MnpbEhh9jyipgxe19OcubqV5w
April 1, 2024
198484
Monaco
MCO
true
2
1
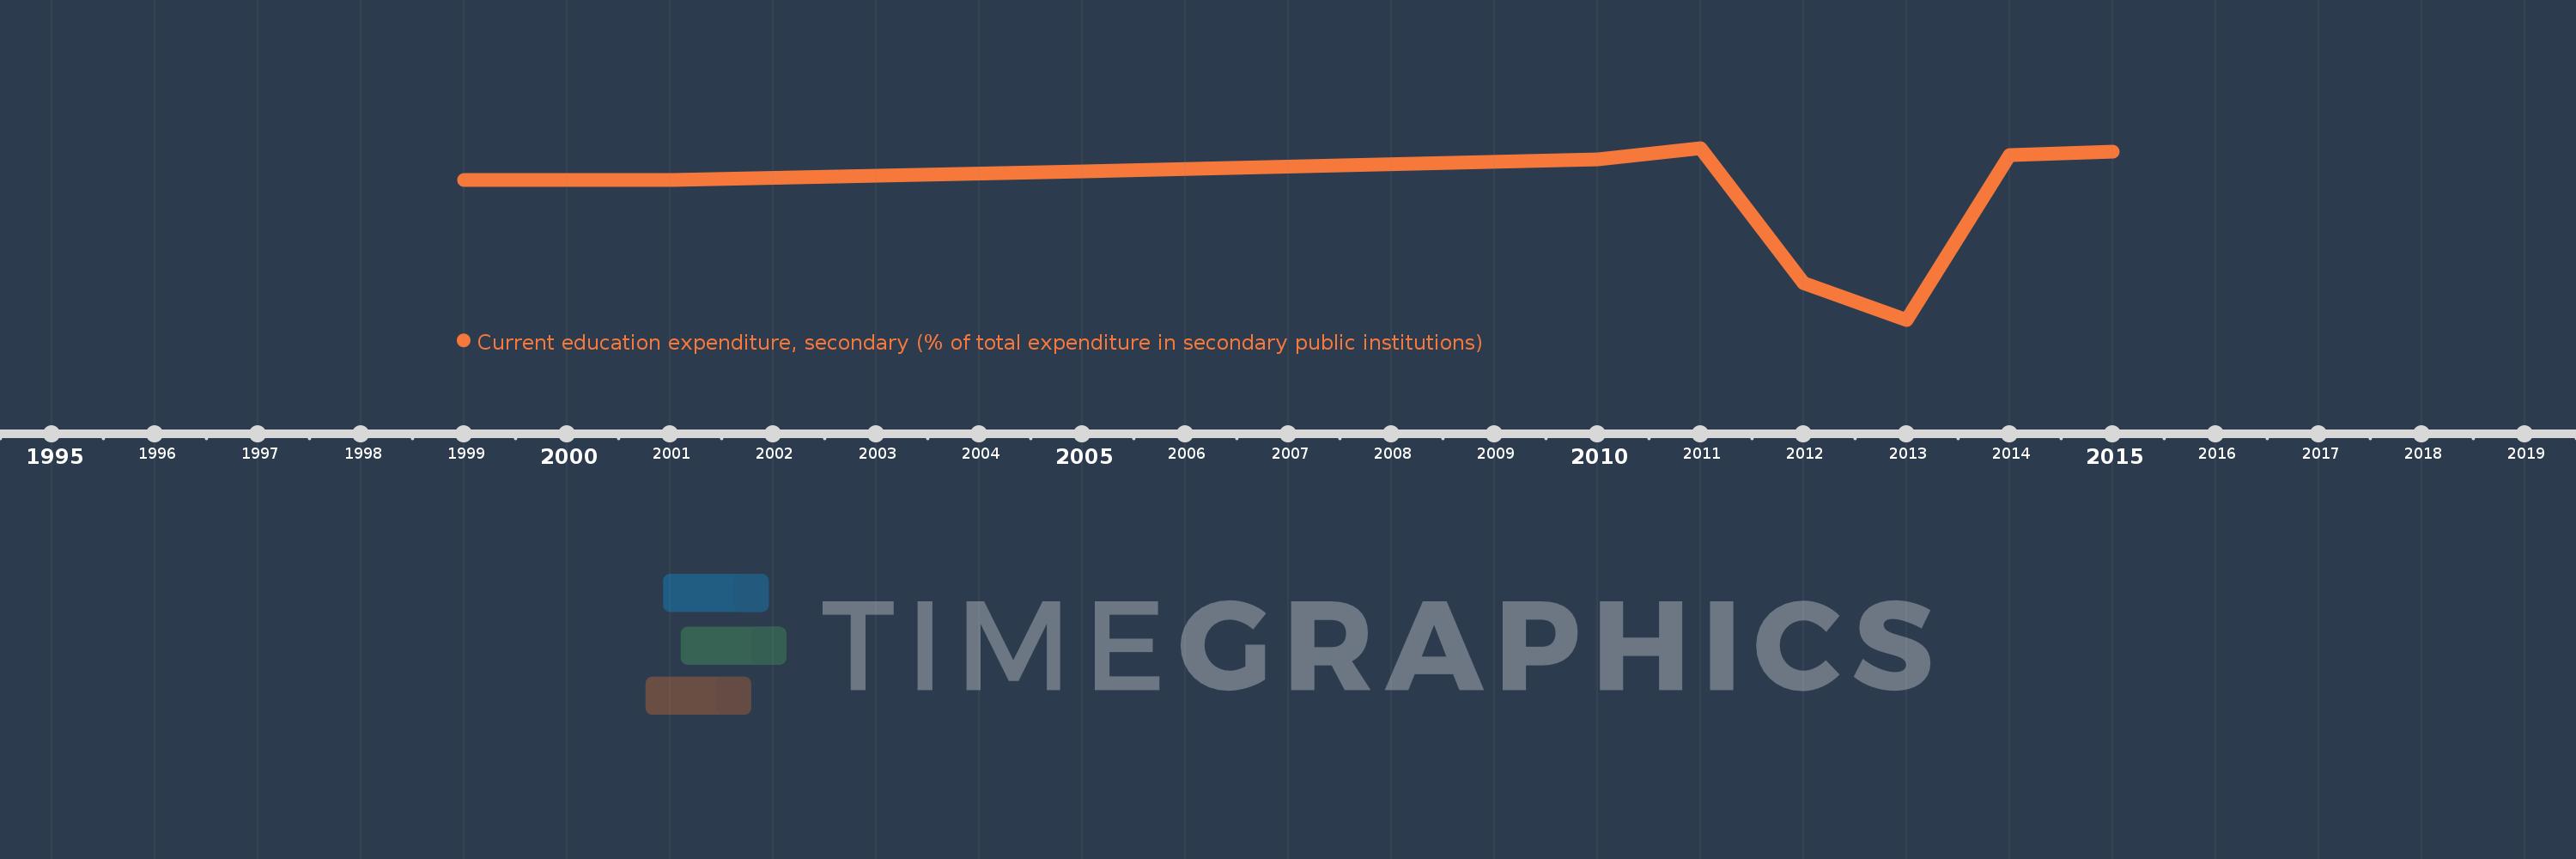
Current education expenditure, secondary (% of total expenditure in secondary public institutions)
2015,2014,2013,2012,2011,2010,2005,2001,2000,1999
This statistics in other country:
Timeline:
This timeline shows a graph from 1999 to 2015 of Monaco. No data until 1998. Number of actual observations by date: 10.
Source name:
World Development Indicators
Source organization:
United Nations Educational, Scientific, and Cultural Organization (UNESCO) Institute for Statistics.
Categories, topics:
Education
Last updated:
apr 23, 2017
Indicators value changes by year
Minimum:
44.765
jan 1, 2013
Maximum:
99.339
jan 1, 2011
At the date of observation
Value
Absolute change
Change from previous value
jan 1, 1999
89.095
+89.095
0.0%
jan 1, 2000
89.114
+0.02
0.02%
jan 1, 2001
89.158
+0.043
0.05%
jan 1, 2005
91.788
+2.631
2.95%
jan 1, 2010
95.842
+4.053
4.42%
jan 1, 2011
99.339
+3.497
3.65%
jan 1, 2012
56.31
-43.029
-43.31%
jan 1, 2013
44.765
-11.545
-20.5%
jan 1, 2014
97.142
+52.378
117.01%
jan 1, 2015
98.136
+0.994
1.02%
Ranking of countries by current statistics by years


Comments: