29
/
en
AIzaSyAYiBZKx7MnpbEhh9jyipgxe19OcubqV5w
April 1, 2024
147795
Guyana
GUY
true
2
1
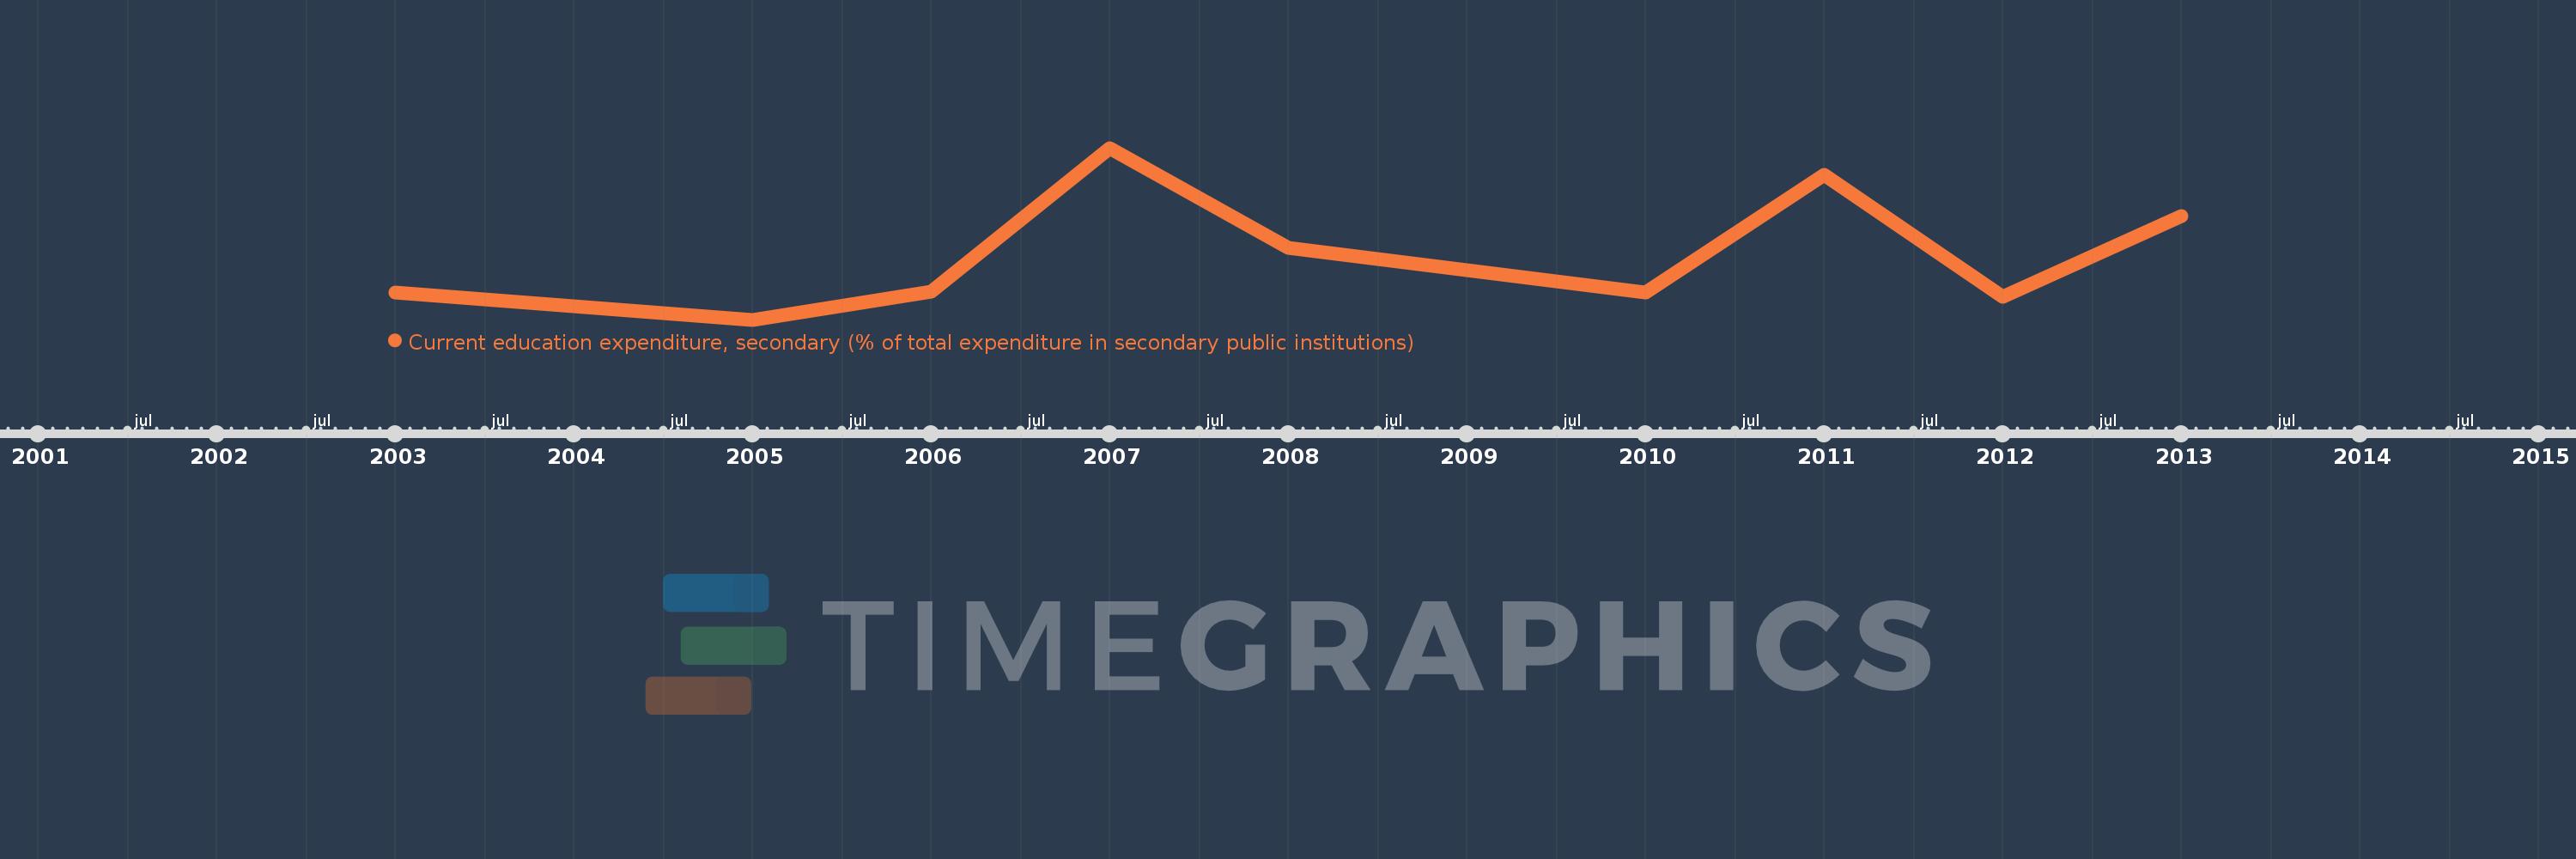
Current education expenditure, secondary (% of total expenditure in secondary public institutions)
2013,2012,2011,2010,2008,2007,2006,2005,2003
This statistics in other country:
Timeline:
This timeline shows a graph from 2003 to 2013 of Guyana. No data until 2002. Number of actual observations by date: 9.
Source name:
World Development Indicators
Source organization:
United Nations Educational, Scientific, and Cultural Organization (UNESCO) Institute for Statistics.
Categories, topics:
Education
Last updated:
apr 23, 2017
Indicators value changes by year
Minimum:
79.644
jan 1, 2005
Maximum:
98.069
jan 1, 2007
At the date of observation
Value
Absolute change
Change from previous value
jan 1, 2003
82.61
+82.61
0.0%
jan 1, 2005
79.644
-2.966
-3.59%
jan 1, 2006
82.662
+3.018
3.79%
jan 1, 2007
98.069
+15.407
18.64%
jan 1, 2008
87.346
-10.722
-10.93%
jan 1, 2010
82.591
-4.756
-5.44%
jan 1, 2011
95.221
+12.63
15.29%
jan 1, 2012
82.14
-13.081
-13.74%
jan 1, 2013
90.739
+8.6
10.47%
Ranking of countries by current statistics by years


Comments: