29
/
en
AIzaSyAYiBZKx7MnpbEhh9jyipgxe19OcubqV5w
April 1, 2024
225739
Portugal
PRT
true
2
1
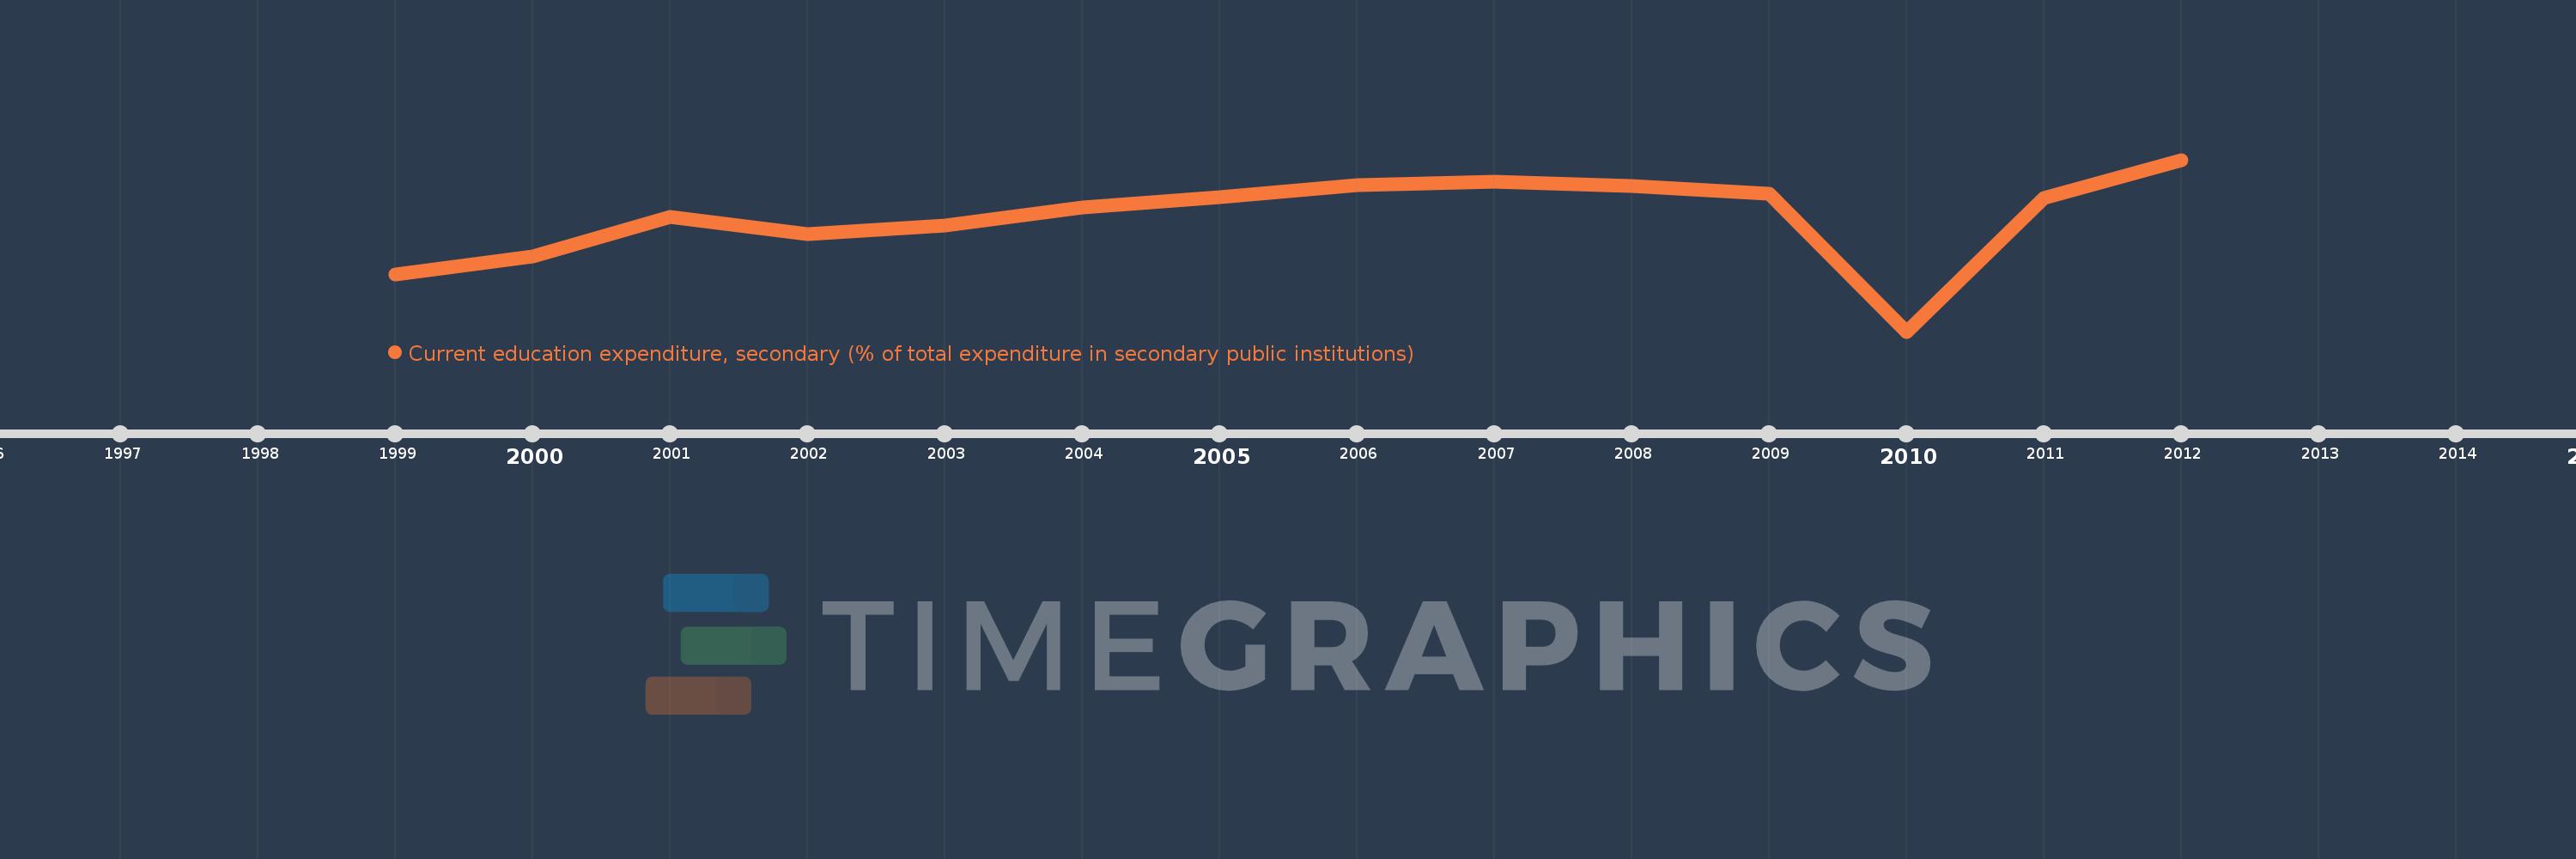
Current education expenditure, secondary (% of total expenditure in secondary public institutions)
2012,2011,2010,2009,2008,2007,2006,2005,2004,2003,2002,2001,2000,1999
This statistics in other country:
Timeline:
This timeline shows a graph from 1999 to 2012 of Portugal. No data until 1998. Number of actual observations by date: 14.
Source name:
World Development Indicators
Source organization:
United Nations Educational, Scientific, and Cultural Organization (UNESCO) Institute for Statistics.
Categories, topics:
Education
Last updated:
apr 23, 2017
Indicators value changes by year
Minimum:
89.422
jan 1, 2010
Maximum:
98.667
jan 1, 2012
At the date of observation
Value
Absolute change
Change from previous value
jan 1, 1999
92.488
+92.488
0.0%
jan 1, 2000
93.452
+0.965
1.04%
jan 1, 2001
95.609
+2.157
2.31%
jan 1, 2002
94.679
-0.929
-0.97%
jan 1, 2003
95.146
+0.467
0.49%
jan 1, 2004
96.118
+0.972
1.02%
jan 1, 2005
96.65
+0.533
0.55%
jan 1, 2006
97.289
+0.639
0.66%
jan 1, 2007
97.495
+0.206
0.21%
jan 1, 2008
97.263
-0.232
-0.24%
jan 1, 2009
96.834
-0.429
-0.44%
jan 1, 2010
89.422
-7.412
-7.65%
jan 1, 2011
96.608
+7.185
8.04%
jan 1, 2012
98.667
+2.059
2.13%
Ranking of countries by current statistics by years


Comments: