29
/
en
AIzaSyAYiBZKx7MnpbEhh9jyipgxe19OcubqV5w
April 1, 2024
228290
Romania
ROU
true
2
1
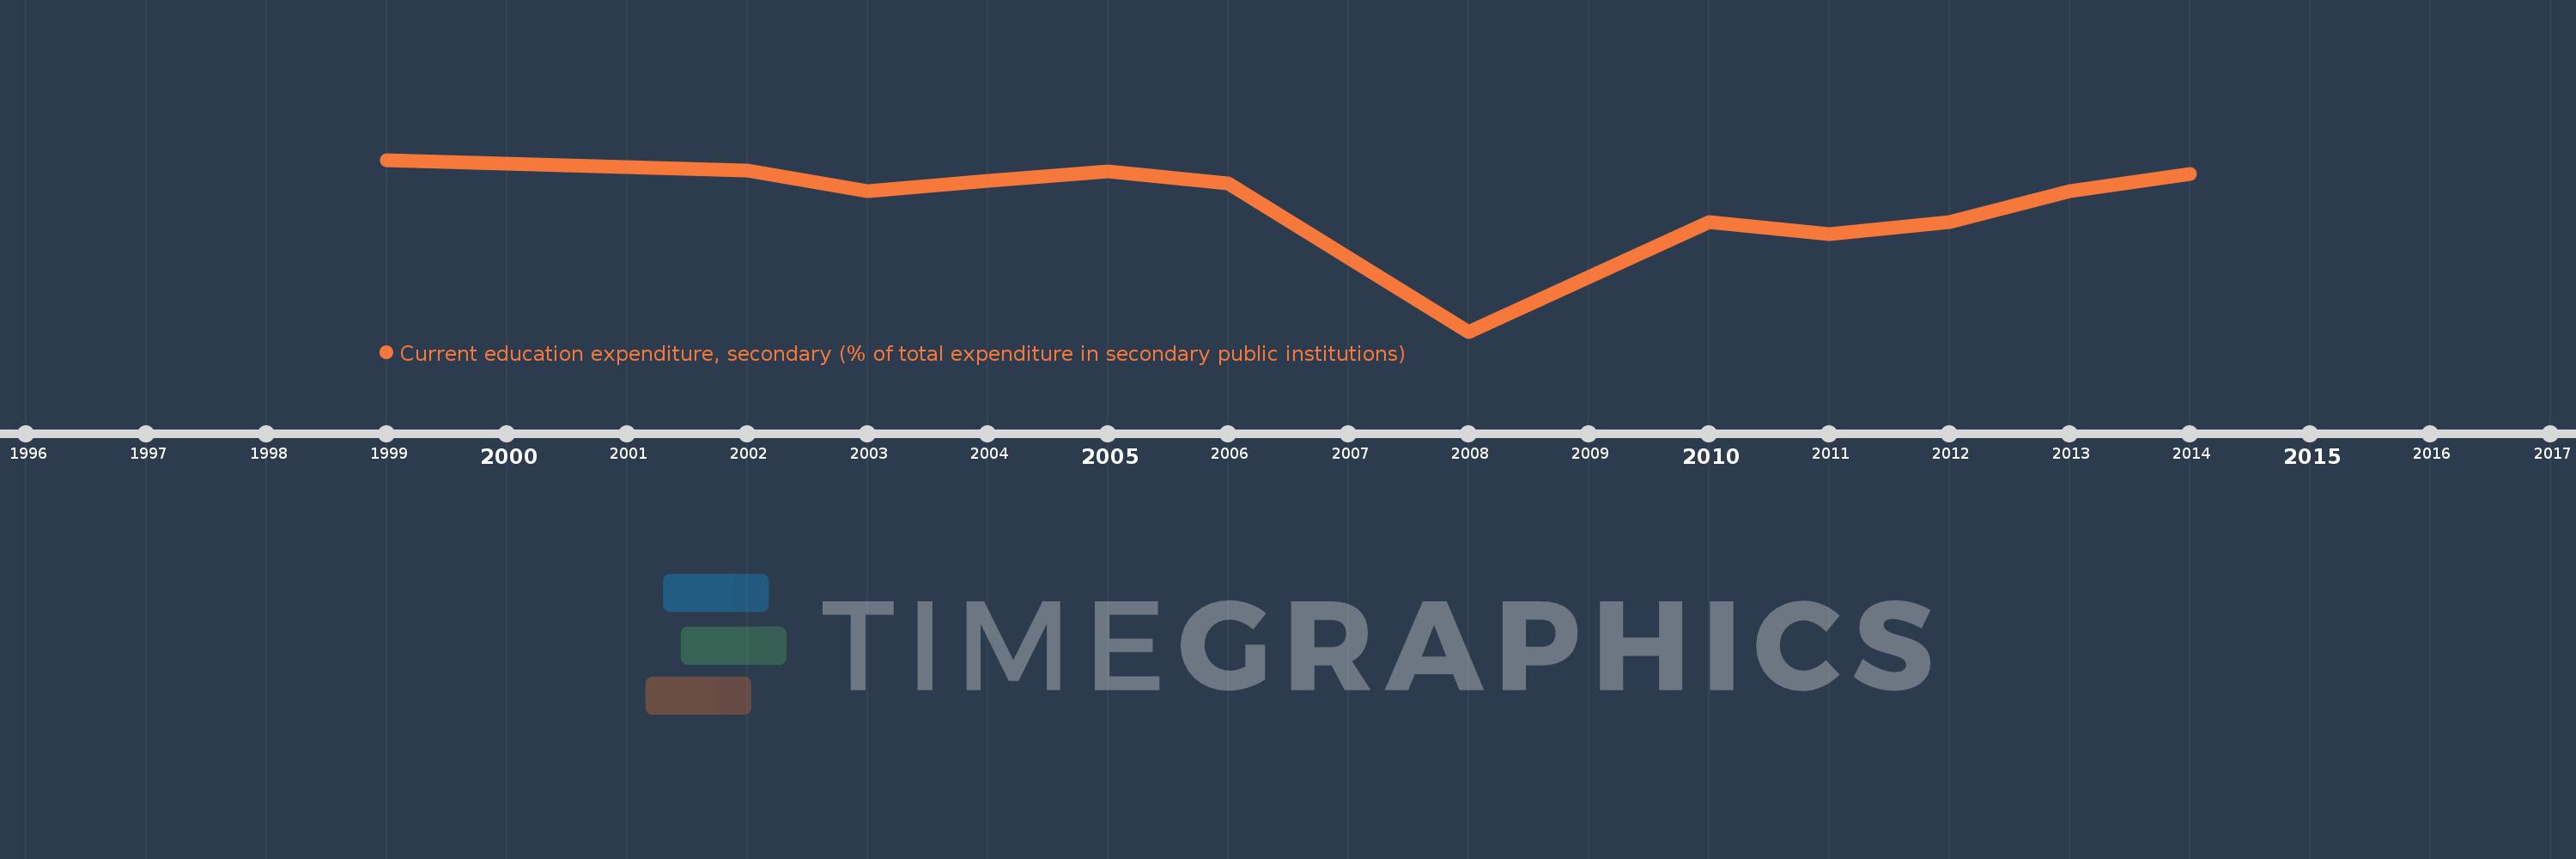
Current education expenditure, secondary (% of total expenditure in secondary public institutions)
2014,2013,2012,2011,2010,2008,2006,2005,2004,2003,2002,1999
This statistics in other country:
Timeline:
This timeline shows a graph from 1999 to 2014 of Romania. No data until 1998. Number of actual observations by date: 12.
Source name:
World Development Indicators
Source organization:
United Nations Educational, Scientific, and Cultural Organization (UNESCO) Institute for Statistics.
Categories, topics:
Education
Last updated:
apr 23, 2017
Indicators value changes by year
Minimum:
80.647
jan 1, 2008
Maximum:
97.326
jan 1, 1999
At the date of observation
Value
Absolute change
Change from previous value
jan 1, 1999
97.326
+97.326
0.0%
jan 1, 2002
96.297
-1.029
-1.06%
jan 1, 2003
94.243
-2.054
-2.13%
jan 1, 2004
95.313
+1.071
1.14%
jan 1, 2005
96.162
+0.849
0.89%
jan 1, 2006
95.045
-1.118
-1.16%
jan 1, 2008
80.647
-14.398
-15.15%
jan 1, 2010
91.286
+10.64
13.19%
jan 1, 2011
90.153
-1.133
-1.24%
jan 1, 2012
91.255
+1.102
1.22%
jan 1, 2013
94.291
+3.035
3.33%
jan 1, 2014
95.916
+1.625
1.72%
Ranking of countries by current statistics by years


Comments: