29
/
en
AIzaSyAYiBZKx7MnpbEhh9jyipgxe19OcubqV5w
April 1, 2024
42242
Latin America & Caribbean (excluding high income)
LAC
false
2
1
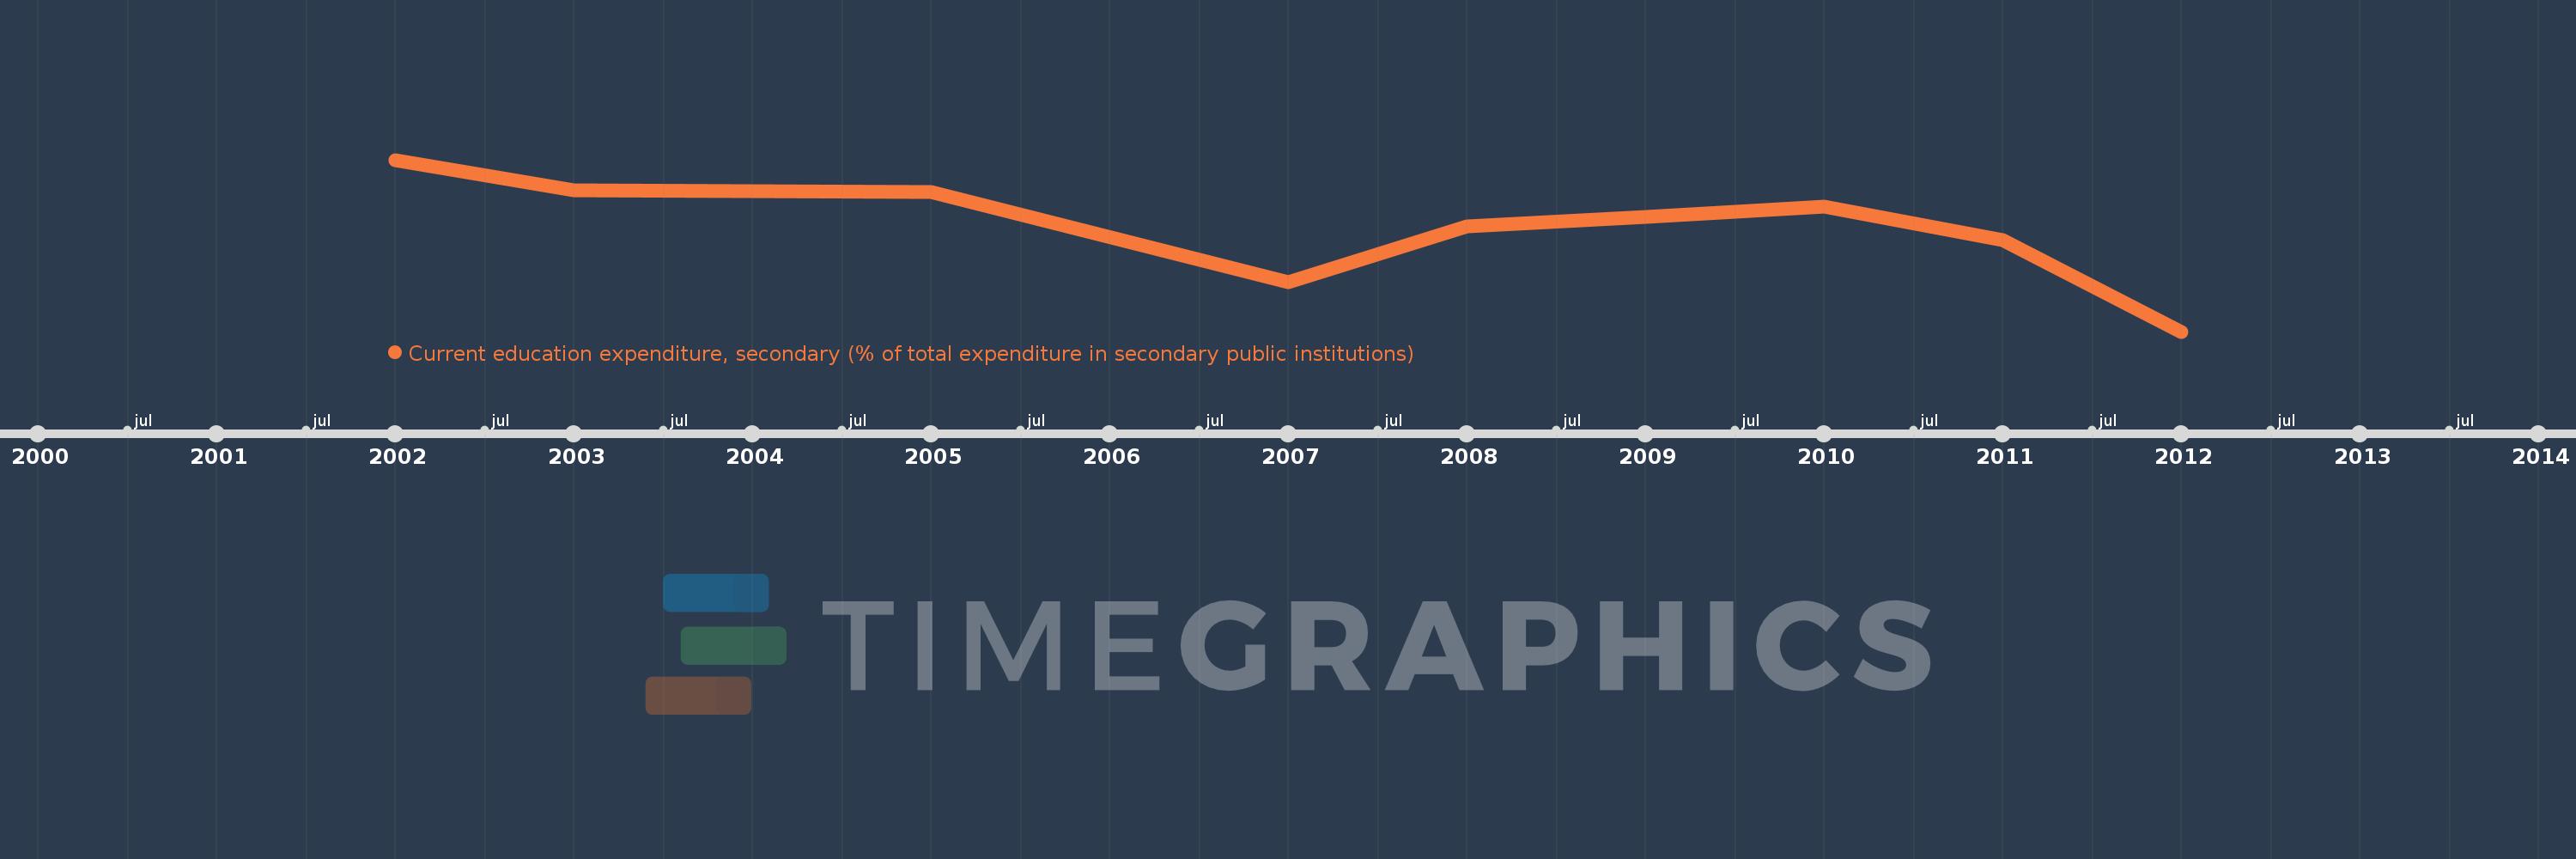
Current education expenditure, secondary (% of total expenditure in secondary public institutions)
2012,2011,2010,2009,2008,2007,2005,2003,2002
This statistics in other country:
Timeline:
This timeline shows a graph from 2002 to 2012 of Latin America & Caribbean (excluding high income). No data until 2001. Number of actual observations by date: 9.
Source name:
World Development Indicators
Source organization:
United Nations Educational, Scientific, and Cultural Organization (UNESCO) Institute for Statistics.
Categories, topics:
Education
Last updated:
apr 23, 2017
Indicators value changes by year
Minimum:
92.188
jan 1, 2012
Maximum:
97.712
jan 1, 2002
At the date of observation
Value
Absolute change
Change from previous value
jan 1, 2002
97.712
+97.712
0.0%
jan 1, 2003
96.744
-0.967
-0.99%
jan 1, 2005
96.671
-0.073
-0.08%
jan 1, 2007
93.787
-2.884
-2.98%
jan 1, 2008
95.578
+1.791
1.91%
jan 1, 2009
95.871
+0.292
0.31%
jan 1, 2010
96.197
+0.327
0.34%
jan 1, 2011
95.123
-1.074
-1.12%
jan 1, 2012
92.188
-2.935
-3.09%
Ranking of countries by current statistics by years


Comments: