29
/
en
AIzaSyAYiBZKx7MnpbEhh9jyipgxe19OcubqV5w
April 1, 2024
187606
Malaysia
MYS
true
2
1
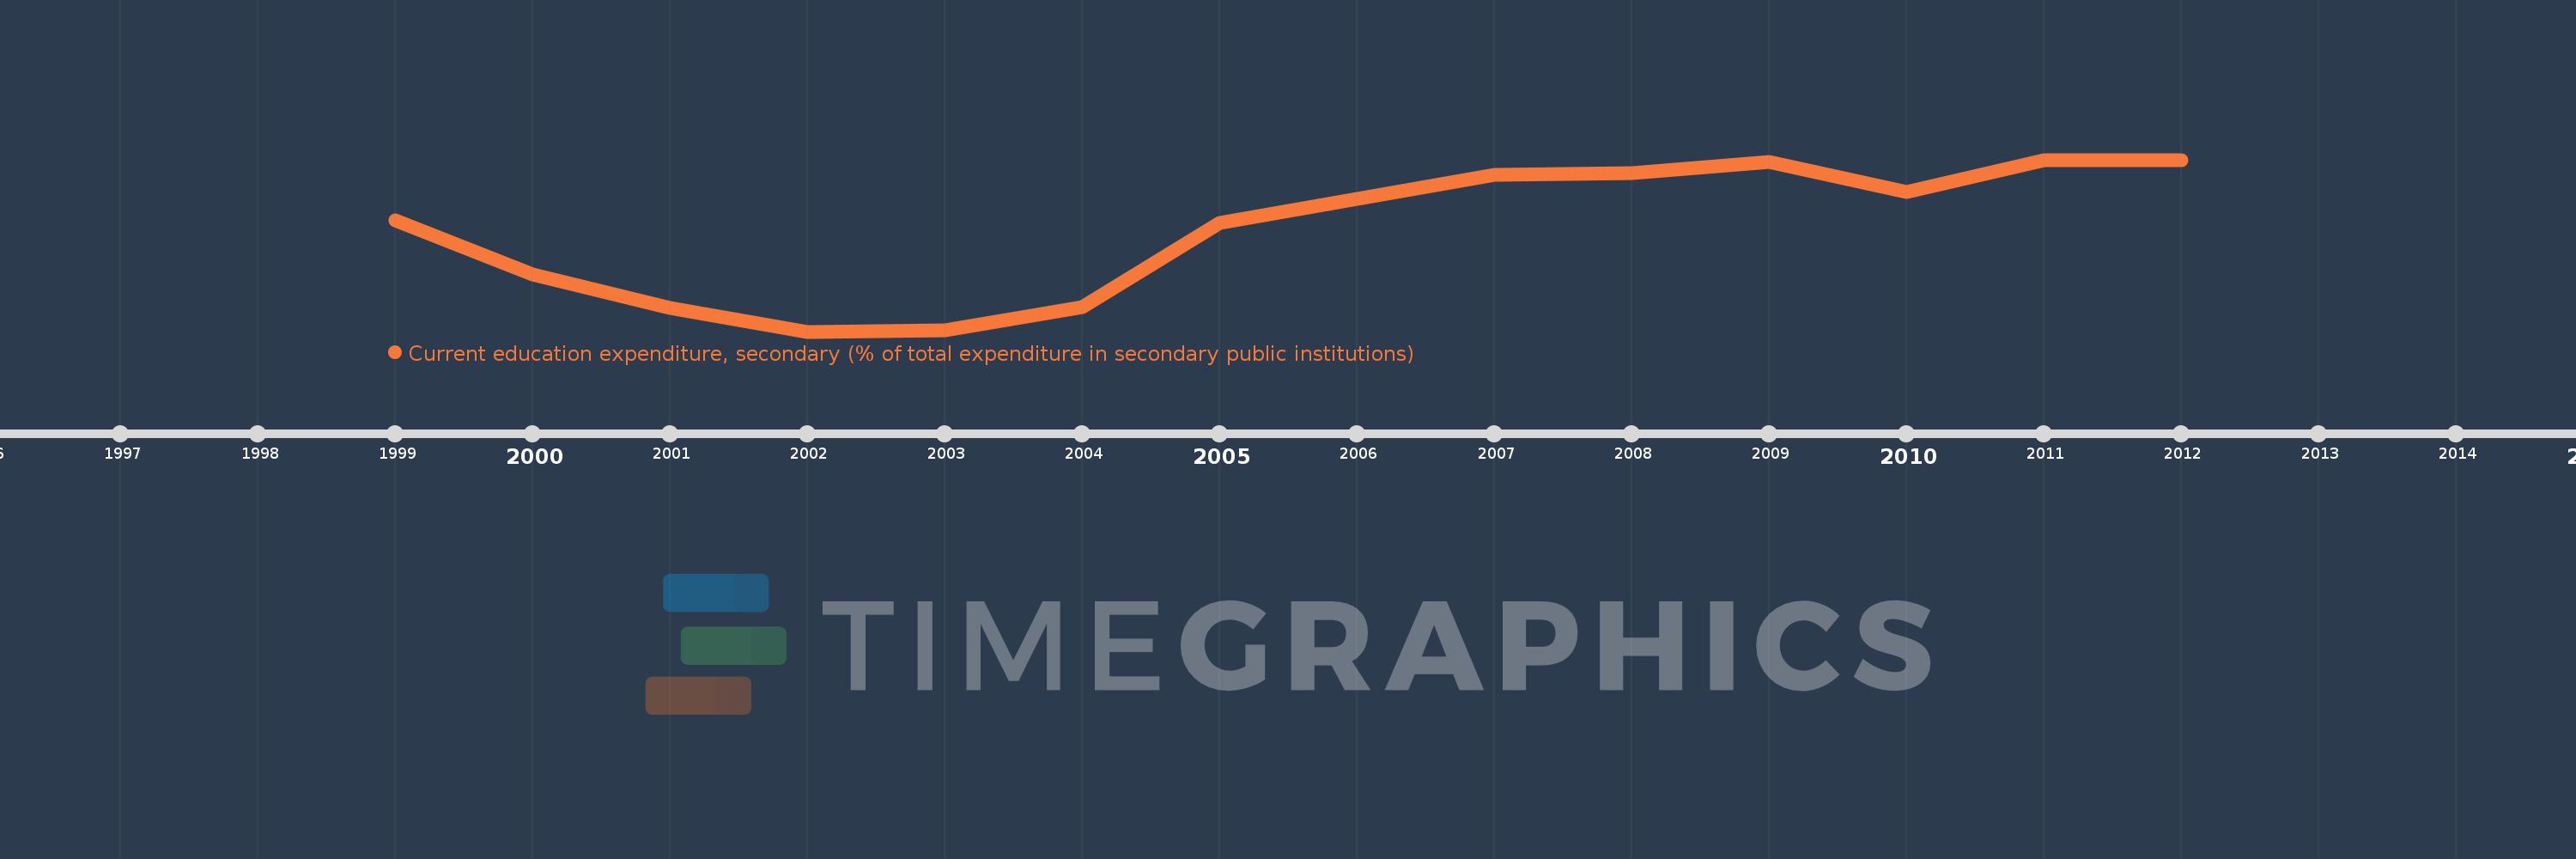
Current education expenditure, secondary (% of total expenditure in secondary public institutions)
2012,2011,2010,2009,2008,2007,2005,2004,2003,2002,2001,2000,1999
This statistics in other country:
Timeline:
This timeline shows a graph from 1999 to 2012 of Malaysia. No data until 1998. Number of actual observations by date: 13.
Source name:
World Development Indicators
Source organization:
United Nations Educational, Scientific, and Cultural Organization (UNESCO) Institute for Statistics.
Categories, topics:
Education
Last updated:
apr 23, 2017
Indicators value changes by year
Minimum:
60.689
jan 1, 2002
Maximum:
99.987
jan 1, 2011
At the date of observation
Value
Absolute change
Change from previous value
jan 1, 1999
86.079
+86.079
0.0%
jan 1, 2000
73.66
-12.419
-14.43%
jan 1, 2001
66.172
-7.488
-10.17%
jan 1, 2002
60.689
-5.483
-8.29%
jan 1, 2003
60.904
+0.216
0.36%
jan 1, 2004
66.213
+5.309
8.72%
jan 1, 2005
85.558
+19.345
29.22%
jan 1, 2007
96.605
+11.047
12.91%
jan 1, 2008
96.969
+0.364
0.38%
jan 1, 2009
99.489
+2.52
2.6%
jan 1, 2010
92.688
-6.8
-6.83%
jan 1, 2011
99.987
+7.299
7.87%
jan 1, 2012
99.981
-0.006
-0.01%
Ranking of countries by current statistics by years


Comments: